Big picture
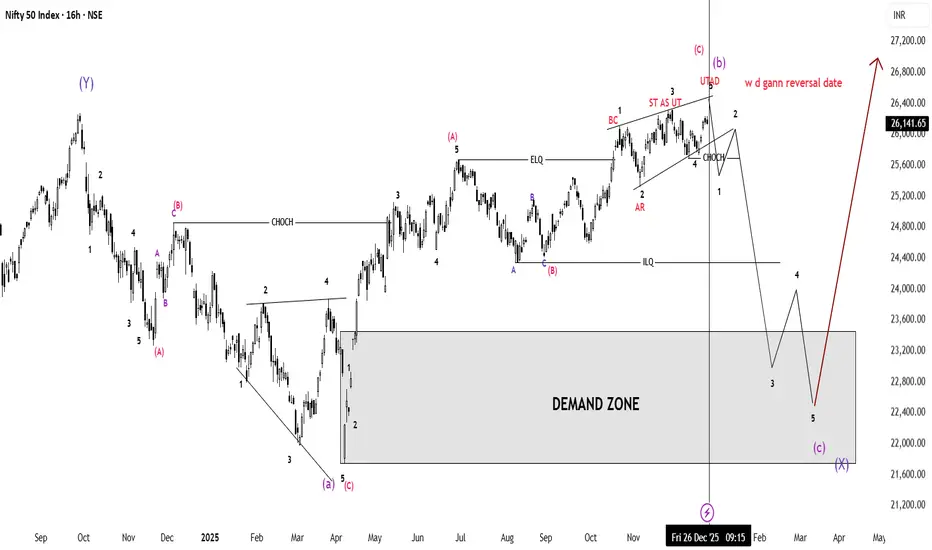
NIFTY has completed a strong up-move and is now near a major top / distribution zone.
The chart suggests:
short-term topping → medium-term correction → long-term bullish continuation.
So this is not a crash view, but a healthy correction before the next big rise.
Left side (past structure)
Earlier waves (Y) and (A-B-C) show a completed corrective phase.
A strong rally followed from the large demand zone (grey area).
This confirms institutional buying from lower levels.
Middle section (trend change confirmation)
CHOCH (Change of Character) appears:
Market behavior shifts
Momentum slows
Smart money starts distributing
Price still makes higher highs, but strength is reducing.
Right side (current situation – very important)
🔴 Distribution near the top
BC (Buying Climax) → last aggressive buying
ST as UT (Secondary Test as Upthrust) → price revisits highs but fails
UTAD (Upthrust After Distribution):
Fake breakout above resistance
Traps late buyers
This is a classic Wyckoff distribution pattern.
The vertical line (timing)
Marked as “W.D. Gann reversal date”
This suggests a time-based reversal, not just price-based.
Around this date, trend direction is expected to change.
Expected move (black path)
Small pullback → bounce (to trap buyers)
Breakdown after CHOCH
Sharp fall into the DEMAND ZONE (22,000–23,500 area approx.)
Completion of corrective wave (C) / (X)
Demand Zone (grey box)
This is where:
Big money previously bought
Strong support exists
Expected to act as a major bottom for the correction.
After the correction (red arrow)
Once price stabilizes in the demand zone:
Strong bullish reversal expected
Start of a new impulsive uptrend
Target shows new all-time highs over the coming months.
Simple summary (no jargon)
📈 Market has gone up a lot
⚠️ Now topping and trapping late buyers
📉 Expect a deep but controlled correction
🧠 Smart money likely buys again at lower levels
🚀 Bigger rally comes after the correction
In one line:
Short-term bearish, medium-term corrective, long-term bullish.
คำจำกัดสิทธิ์ความรับผิดชอบ
ข้อมูลและบทความไม่ได้มีวัตถุประสงค์เพื่อก่อให้เกิดกิจกรรมทางการเงิน, การลงทุน, การซื้อขาย, ข้อเสนอแนะ หรือคำแนะนำประเภทอื่น ๆ ที่ให้หรือรับรองโดย TradingView อ่านเพิ่มเติมใน ข้อกำหนดการใช้งาน
คำจำกัดสิทธิ์ความรับผิดชอบ
ข้อมูลและบทความไม่ได้มีวัตถุประสงค์เพื่อก่อให้เกิดกิจกรรมทางการเงิน, การลงทุน, การซื้อขาย, ข้อเสนอแนะ หรือคำแนะนำประเภทอื่น ๆ ที่ให้หรือรับรองโดย TradingView อ่านเพิ่มเติมใน ข้อกำหนดการใช้งาน