Nifty has shown strong bullish momentum on the monthly charts, maintaining its long-term uptrend structure. The larger trend continues to be positive, and once the ongoing consolidation completes, there's a high probability of the market heading towards a new all-time high around 26450.
On the weekly charts, Nifty appears to be taking a pause at the top, currently at a crucial decision zone. Price action here will decide the next major leg:
Sustained strength above 25800 will likely resume the uptrend toward ATH levels.
Failure to hold could trigger a short-term correction.
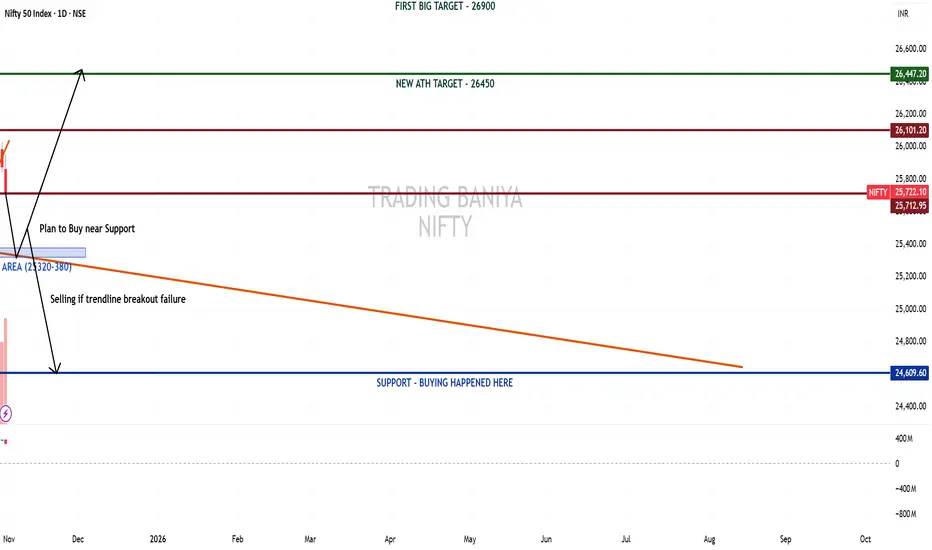
On the daily chart, an M pattern has formed at the top, accompanied by a trendline breakdown. This suggests a possible short-term pullback toward the support area between 25320 – 25380, which aligns with a previous breakout zone and near-term demand region.
This zone can act as a buying opportunity near support if price stabilizes and reverses.
However, if this area also breaks decisively, expect a sharper decline toward 24600 (major support where buying previously emerged).
Trade Plan:
📉 Short-term: Expect dip toward 25320–25380.
📈 Medium-term: Look for reversal signs near support to ride the next rally toward 26,100 and 26450 (ATH).
❌ Invalidation: Breakdown below 25,320 with volume and failure to reclaim trendline.
On the weekly charts, Nifty appears to be taking a pause at the top, currently at a crucial decision zone. Price action here will decide the next major leg:
Sustained strength above 25800 will likely resume the uptrend toward ATH levels.
Failure to hold could trigger a short-term correction.
On the daily chart, an M pattern has formed at the top, accompanied by a trendline breakdown. This suggests a possible short-term pullback toward the support area between 25320 – 25380, which aligns with a previous breakout zone and near-term demand region.
This zone can act as a buying opportunity near support if price stabilizes and reverses.
However, if this area also breaks decisively, expect a sharper decline toward 24600 (major support where buying previously emerged).
Trade Plan:
📉 Short-term: Expect dip toward 25320–25380.
📈 Medium-term: Look for reversal signs near support to ride the next rally toward 26,100 and 26450 (ATH).
❌ Invalidation: Breakdown below 25,320 with volume and failure to reclaim trendline.
Trading Baniya
คำจำกัดสิทธิ์ความรับผิดชอบ
ข้อมูลและบทความไม่ได้มีวัตถุประสงค์เพื่อก่อให้เกิดกิจกรรมทางการเงิน, การลงทุน, การซื้อขาย, ข้อเสนอแนะ หรือคำแนะนำประเภทอื่น ๆ ที่ให้หรือรับรองโดย TradingView อ่านเพิ่มเติมใน ข้อกำหนดการใช้งาน
Trading Baniya
คำจำกัดสิทธิ์ความรับผิดชอบ
ข้อมูลและบทความไม่ได้มีวัตถุประสงค์เพื่อก่อให้เกิดกิจกรรมทางการเงิน, การลงทุน, การซื้อขาย, ข้อเสนอแนะ หรือคำแนะนำประเภทอื่น ๆ ที่ให้หรือรับรองโดย TradingView อ่านเพิ่มเติมใน ข้อกำหนดการใช้งาน