The Nifty 50 opened with a gap-up of 165 points (0.71%) and ended the week at 23,519.35 (0.72%), forming a long upper shadow candle on the weekly timeframe.
Understanding the Long Upper Shadow Candle
A long upper shadow candle suggests that Nifty attempted to move higher but faced strong selling pressure, causing it to close significantly lower than its weekly high. This pattern indicates:
If Nifty sustains below 23,443, selling pressure may increase. However, a move above 23,597 could restore bullish momentum.
Key Levels for the Upcoming Week
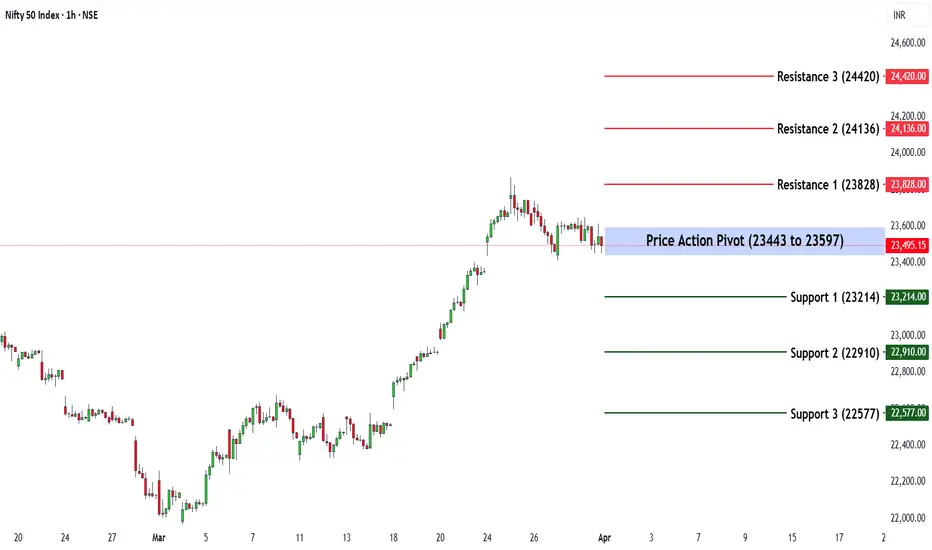
🔹 Price Action Pivot Zone:
The crucial range to watch for potential trend reversals or continuation is 23,443 - 23,597.
🔹 Support & Resistance Levels:
Support:
S1: 23,214
S2: 22,910
S3: 22,577
Resistance:
R1: 23,828
R2: 24,136
R3: 24,420
Market Outlook
✅ Bullish Scenario: A sustained breakout above 23,597 could attract buying momentum, driving Nifty towards R1 (23,828) and beyond.
❌ Bearish Scenario: A drop below 23,443 may trigger selling pressure, pushing Nifty towards S1 (23,214) or lower.
Disclaimer: This analysis is for educational purposes only. Investors should conduct their own research before making any trading decisions.
Understanding the Long Upper Shadow Candle
A long upper shadow candle suggests that Nifty attempted to move higher but faced strong selling pressure, causing it to close significantly lower than its weekly high. This pattern indicates:
- Bearish Rejection at Higher Levels– Buyers pushed prices up, but selling pressure forced a pullback, showing weakness at higher levels.
- Potential Trend Reversal or Weakness – If followed by a bearish candle, it may signal further downside or correction.
- Indecisiveness & Profit Booking – The formation suggests hesitation among traders, possibly due to profit booking by institutional investors.
If Nifty sustains below 23,443, selling pressure may increase. However, a move above 23,597 could restore bullish momentum.
Key Levels for the Upcoming Week
🔹 Price Action Pivot Zone:
The crucial range to watch for potential trend reversals or continuation is 23,443 - 23,597.
🔹 Support & Resistance Levels:
Support:
S1: 23,214
S2: 22,910
S3: 22,577
Resistance:
R1: 23,828
R2: 24,136
R3: 24,420
Market Outlook
✅ Bullish Scenario: A sustained breakout above 23,597 could attract buying momentum, driving Nifty towards R1 (23,828) and beyond.
❌ Bearish Scenario: A drop below 23,443 may trigger selling pressure, pushing Nifty towards S1 (23,214) or lower.
Disclaimer: This analysis is for educational purposes only. Investors should conduct their own research before making any trading decisions.
คำจำกัดสิทธิ์ความรับผิดชอบ
ข้อมูลและบทความไม่ได้มีวัตถุประสงค์เพื่อก่อให้เกิดกิจกรรมทางการเงิน, การลงทุน, การซื้อขาย, ข้อเสนอแนะ หรือคำแนะนำประเภทอื่น ๆ ที่ให้หรือรับรองโดย TradingView อ่านเพิ่มเติมที่ ข้อกำหนดการใช้งาน
คำจำกัดสิทธิ์ความรับผิดชอบ
ข้อมูลและบทความไม่ได้มีวัตถุประสงค์เพื่อก่อให้เกิดกิจกรรมทางการเงิน, การลงทุน, การซื้อขาย, ข้อเสนอแนะ หรือคำแนะนำประเภทอื่น ๆ ที่ให้หรือรับรองโดย TradingView อ่านเพิ่มเติมที่ ข้อกำหนดการใช้งาน