The NIFTY 50 has broken below a key rising trendline, signaling a potential end to the recent bullish momentum. This breakdown is supported by price action, volume analysis, and open interest data, indicating a shift in market structure.
📊 Chart 1: OI + Volume Profile Insights
📈 Chart 2: Price Action + Volume Structure
⚙️ Trade Setups
🔻 Bearish Breakdown
🔁 Bullish Reversal
⚠️ Rangebound Watch
🧠 Summary
This is more than a minor dip — it's a technical structure break:
Unless the bulls reclaim 24,800+ soon, the path of least resistance appears downward.
💬 What’s your bias — breakdown or bounce? Share your view in the comments.
📊 Chart 1: OI + Volume Profile Insights
- Heavy Call OI buildup near 24,800–25,000, creating a strong resistance zone.
- Price rejected from this area and broke below the ascending trendline.
- Breakdown came with increased selling interest and a low volume node below 24,500, which could trigger a swift move downward.
- Multiple expiry OI clusters confirm the bearish bias in the near term.
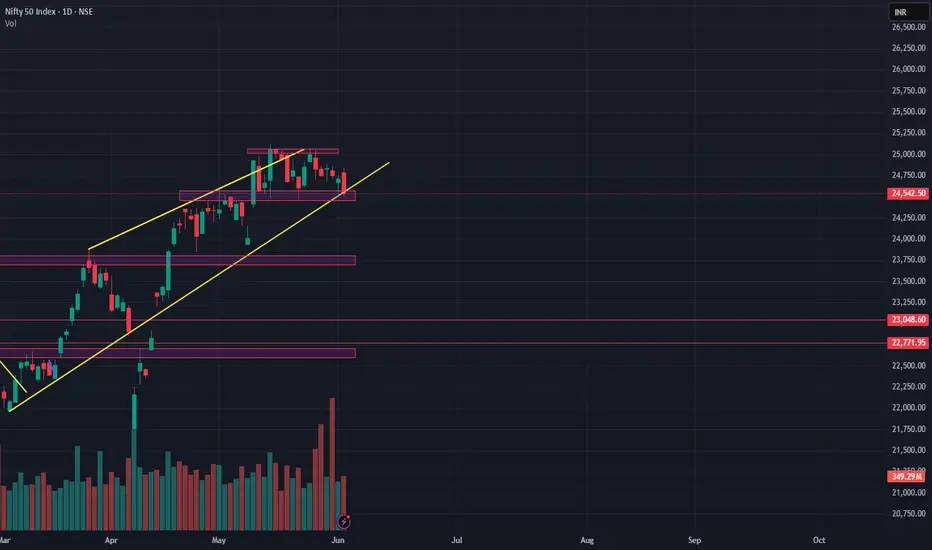
📈 Chart 2: Price Action + Volume Structure
- Rising channel/wedge decisively broken on high volume.
- Key support at 24,400–24,500 is being tested.
- Below this zone, next supports lie at:
23,750 (horizontal demand zone)
23,048 (Feb–March consolidation zone)
22,771 (weekly demand) - Volume indicates increased participation at the top — possibly distribution.
⚙️ Trade Setups
🔻 Bearish Breakdown
- Entry Trigger: Below 24,500
- Targets: 24,200 → 23,750 → 23,050
- Stop Loss: 24,620
🔁 Bullish Reversal
- Entry Trigger: Close above 24,800
- Targets: 25,000 → 25,200
- Stop Loss: 24,600
⚠️ Rangebound Watch
- Entry Trigger: Between 24,500–24,800
- Targets: Wait & react
- Stop Loss: –
🧠 Summary
This is more than a minor dip — it's a technical structure break:
- ✅ Trendline lost
- ✅ Rising wedge breakdown
- ✅ OI resistance above
- ✅ Volume confirming shift
Unless the bulls reclaim 24,800+ soon, the path of least resistance appears downward.
💬 What’s your bias — breakdown or bounce? Share your view in the comments.
คำจำกัดสิทธิ์ความรับผิดชอบ
ข้อมูลและบทความไม่ได้มีวัตถุประสงค์เพื่อก่อให้เกิดกิจกรรมทางการเงิน, การลงทุน, การซื้อขาย, ข้อเสนอแนะ หรือคำแนะนำประเภทอื่น ๆ ที่ให้หรือรับรองโดย TradingView อ่านเพิ่มเติมใน ข้อกำหนดการใช้งาน
คำจำกัดสิทธิ์ความรับผิดชอบ
ข้อมูลและบทความไม่ได้มีวัตถุประสงค์เพื่อก่อให้เกิดกิจกรรมทางการเงิน, การลงทุน, การซื้อขาย, ข้อเสนอแนะ หรือคำแนะนำประเภทอื่น ๆ ที่ให้หรือรับรองโดย TradingView อ่านเพิ่มเติมใน ข้อกำหนดการใช้งาน