In previous chart, Expected upsurge accomplished:

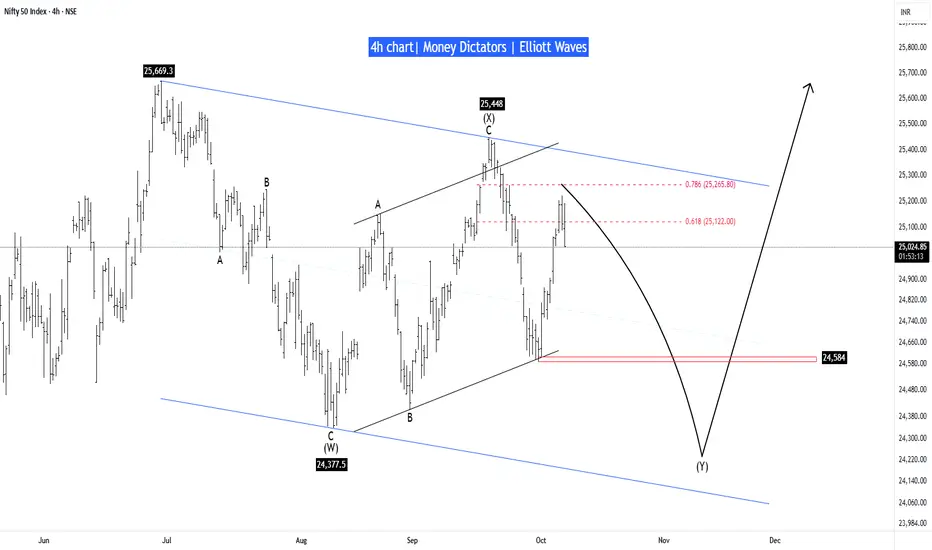
Nifty has reached the optimal supply zone and is expected to decline, at least up to 24,584. The retracement of wave A (0.786) could act as a strong resistance for a reversal. The lower boundary lies at 24,120, while 24,377 marks the low of wave (W). It’s better to consider the lower boundary as the potential maximum downside level.
Once the reversal level is identified, we will proceed toward the bullish path.
Stay tuned!
Money_Dictators
Thanks :)
Life-time free telegram channel - t.me/moneydictators
การนำเสนอที่เกี่ยวข้อง
คำจำกัดสิทธิ์ความรับผิดชอบ
ข้อมูลและบทความไม่ได้มีวัตถุประสงค์เพื่อก่อให้เกิดกิจกรรมทางการเงิน, การลงทุน, การซื้อขาย, ข้อเสนอแนะ หรือคำแนะนำประเภทอื่น ๆ ที่ให้หรือรับรองโดย TradingView อ่านเพิ่มเติมที่ ข้อกำหนดการใช้งาน
Life-time free telegram channel - t.me/moneydictators
การนำเสนอที่เกี่ยวข้อง
คำจำกัดสิทธิ์ความรับผิดชอบ
ข้อมูลและบทความไม่ได้มีวัตถุประสงค์เพื่อก่อให้เกิดกิจกรรมทางการเงิน, การลงทุน, การซื้อขาย, ข้อเสนอแนะ หรือคำแนะนำประเภทอื่น ๆ ที่ให้หรือรับรองโดย TradingView อ่านเพิ่มเติมที่ ข้อกำหนดการใช้งาน