📆 NIFTY 15-Min Trading Plan for 7-May-2025
(Structure-Oriented | 100+ Point Gap Consideration | For Educational Purpose Only)
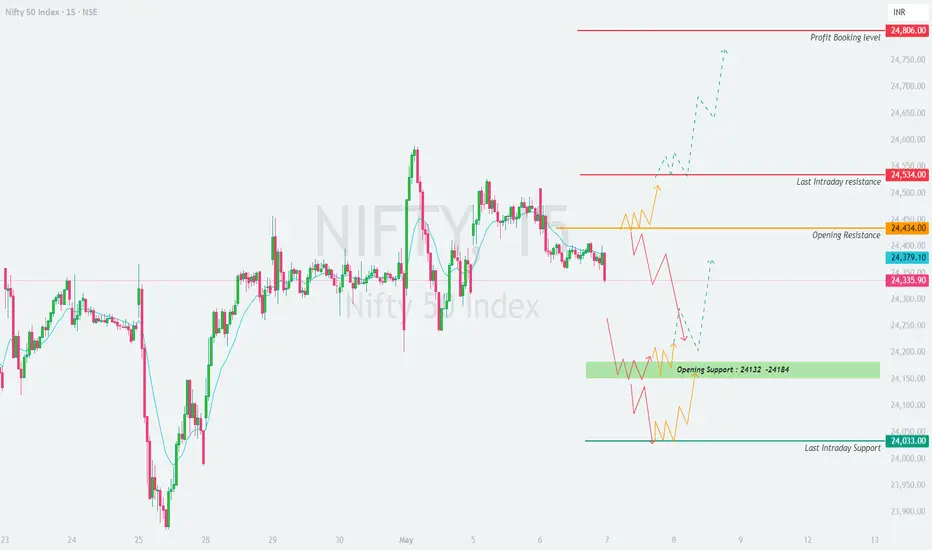
📍 Previous Close: 24,335.90
📌 Important Levels to Watch:
🟧 Opening Resistance: 24,434
🟥 Last Intraday Resistance: 24,534
🟢 Opening Support: 24,132 – 24,184
🟩 Last Intraday Support: 24,033
🔴 Profit Booking Zone: 24,806
🟩 Scenario 1: Gap-Up Opening (Above 24,434) 🚀
(Structure-Oriented | 100+ Point Gap Consideration | For Educational Purpose Only)
📍 Previous Close: 24,335.90
📌 Important Levels to Watch:
🟧 Opening Resistance: 24,434
🟥 Last Intraday Resistance: 24,534
🟢 Opening Support: 24,132 – 24,184
🟩 Last Intraday Support: 24,033
🔴 Profit Booking Zone: 24,806
🟩 Scenario 1: Gap-Up Opening (Above 24,434) 🚀
- [] A gap-up opening above 24,434 indicates bullish strength as it breaches the Opening Resistance.
[] If the index sustains above 24,434 for the first 15–30 mins, there's a high probability of continuation toward 24,534 (Last Intraday Resistance).
[] A breakout above 24,534 with a strong 15-min candle may trigger a rally toward the Profit Booking Level near 24,806.
[] Be cautious if the price hits 24,534 quickly at open—it may reverse from this level. Wait for rejection candles (e.g., long wicks or bearish engulfing) before taking short trades. - If price opens above 24,434 but falls back below it, it could signal a false breakout. This might bring the index back inside the previous range.
📚 Educational Insight: Gap-ups directly into resistance zones require confirmation. Never chase the open blindly—observe structure, momentum, and volume before initiating trades.
⚖️ Scenario 2: Flat Opening (Between 24,300 – 24,434) ⏸️- [] A flat open in this range implies a neutral stance. Avoid rushing into trades during the first 15 minutes.
[] If the price breaks and sustains above 24,434, it could test 24,534 and beyond. Wait for a clear candle close above 24,434 before initiating a long.
[] If price fails to breach 24,434 and starts forming lower highs, bearish momentum may drag the index toward 24,184–24,132 Support Zone.
[] Watch this support area closely—if price forms a reversal pattern like a hammer, morning star, or bullish engulfing, long trades can be considered with a stop below 24,132. - No trade is better than a bad trade inside a consolidation zone. Wait for structure to build.
📚 Educational Insight: Flat openings are indecisive. Be a sniper, not a machine gun—wait patiently for range breakouts or breakdowns before deploying your capital.
🟥 Scenario 3: Gap-Down Opening (Below 24,184) 📉- [] A gap-down below the Opening Support Zone (24,132–24,184) shows weakness. Watch how the price behaves in this zone.
[] If Nifty holds above 24,132 and shows a bullish reversal pattern, a long trade can be attempted targeting a re-test of 24,300–24,434 zone.
[] However, if 24,132 is breached and the index sustains below it, it opens the gates for a deeper correction toward the Last Intraday Support at 24,033.
[] A decisive breakdown below 24,033 can accelerate selling, especially if supported by volume and broader market weakness. - Avoid catching falling knives—wait for signs of reversal before going long in falling markets.
📚 Educational Insight: Gap-downs often trigger panic—but also provide the best risk-reward setups at support zones if price reacts positively. Let the candles speak before you act.
🛡️ Options Trading Risk Management Tips 🧠- [] ⏰ Avoid trading options in the first 15 minutes—premiums are inflated and prone to quick decay or reversal.
[] 💡 Use ATM or ITM strikes for directional trades; they offer better delta and require smaller moves to gain.
[] 🔐 Consider using spreads (Bull Call / Bear Put) to reduce cost and cap risk.
[] ✋ Don’t average losing trades. Define a stop-loss either on the premium (20–30%) or index level.
[] 📓 Maintain a trade journal—it improves discipline and helps refine your setups.
[] 🔢 Risk only 1–2% of total capital per trade. Avoid revenge trading after a loss. - 🧘♂️ Be emotionally detached. Don’t treat the market like a casino—stick to a rule-based system.
📌 Summary & Conclusion:
✅ Gap-Up Above 24,434: Watch for bullish continuation toward 24,534–24,806. Confirm breakout with structure.
✅ Flat Opening (24,300–24,434): Be patient; wait for range breakout or breakdown to develop a clean setup.
✅ Gap-Down Below 24,184: Keep eyes on 24,132 and 24,033 for support. Strong bounce or breakdown will guide direction.
🎯 Focus on key zones, be structure-oriented, and never compromise on risk management. Let price action dictate your entries and exits.
⚠️ Disclaimer:
I am not a SEBI-registered analyst. The above trading plan is purely for educational purposes. Always consult with your financial advisor before making any investment or trading decisions.
- [] ⏰ Avoid trading options in the first 15 minutes—premiums are inflated and prone to quick decay or reversal.
- [] A gap-down below the Opening Support Zone (24,132–24,184) shows weakness. Watch how the price behaves in this zone.
- [] A flat open in this range implies a neutral stance. Avoid rushing into trades during the first 15 minutes.
คำจำกัดสิทธิ์ความรับผิดชอบ
ข้อมูลและบทความไม่ได้มีวัตถุประสงค์เพื่อก่อให้เกิดกิจกรรมทางการเงิน, การลงทุน, การซื้อขาย, ข้อเสนอแนะ หรือคำแนะนำประเภทอื่น ๆ ที่ให้หรือรับรองโดย TradingView อ่านเพิ่มเติมใน ข้อกำหนดการใช้งาน
คำจำกัดสิทธิ์ความรับผิดชอบ
ข้อมูลและบทความไม่ได้มีวัตถุประสงค์เพื่อก่อให้เกิดกิจกรรมทางการเงิน, การลงทุน, การซื้อขาย, ข้อเสนอแนะ หรือคำแนะนำประเภทอื่น ๆ ที่ให้หรือรับรองโดย TradingView อ่านเพิ่มเติมใน ข้อกำหนดการใช้งาน