Nifty 50 – Immediate Trend Analysis (Hourly Chart)
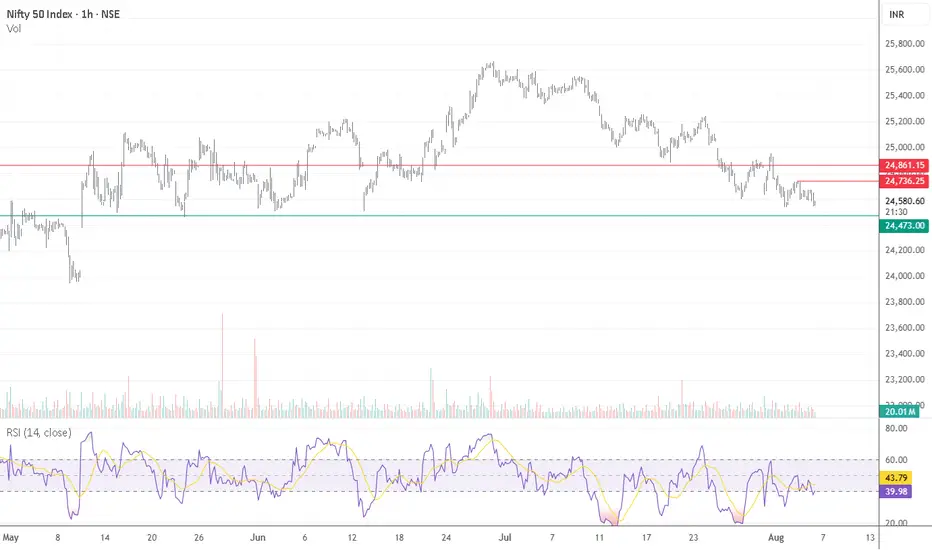
On the hourly chart, Nifty 50 is exhibiting a clear downtrend, forming a pattern of lower highs and lower lows—signaling weakness in the immediate term.
The index has now approached a crucial support zone, which held strong multiple times during May and June, leading to a notable upside reversal in the past. This makes the current level a key inflection point.
If this support level holds, a short-term bounce is likely.
However, a break below this zone could accelerate the decline, potentially taking the index quickly towards the 24,000 level.
Key Takeaway:
Monitor this support zone closely for confirmation of a bounce or a breakdown to position accordingly.
#Nifty50 #NiftyAnalysis #TechnicalAnalysis #StockMarketIndia #NiftySupport #HourlyChart #Downtrend #MarketUpdate #NSE #IndexWatch #TradingStrategy #BreakdownOrBounce #PriceAction #ChartAnalysis #NiftyLevels
คำจำกัดสิทธิ์ความรับผิดชอบ
ข้อมูลและบทความไม่ได้มีวัตถุประสงค์เพื่อก่อให้เกิดกิจกรรมทางการเงิน, การลงทุน, การซื้อขาย, ข้อเสนอแนะ หรือคำแนะนำประเภทอื่น ๆ ที่ให้หรือรับรองโดย TradingView อ่านเพิ่มเติมที่ ข้อกำหนดการใช้งาน
คำจำกัดสิทธิ์ความรับผิดชอบ
ข้อมูลและบทความไม่ได้มีวัตถุประสงค์เพื่อก่อให้เกิดกิจกรรมทางการเงิน, การลงทุน, การซื้อขาย, ข้อเสนอแนะ หรือคำแนะนำประเภทอื่น ๆ ที่ให้หรือรับรองโดย TradingView อ่านเพิ่มเติมที่ ข้อกำหนดการใช้งาน