The Nifty 50, a benchmark index of the National Stock Exchange (NSE) in India, has shown a bullish trend recently, but its performance for the upcoming week (starting May 5, 2025) will likely be influenced by a mix of technical levels, macroeconomic factors, and market sentiment. Below is an overview based on recent analyses and market data:
Technical Analysis
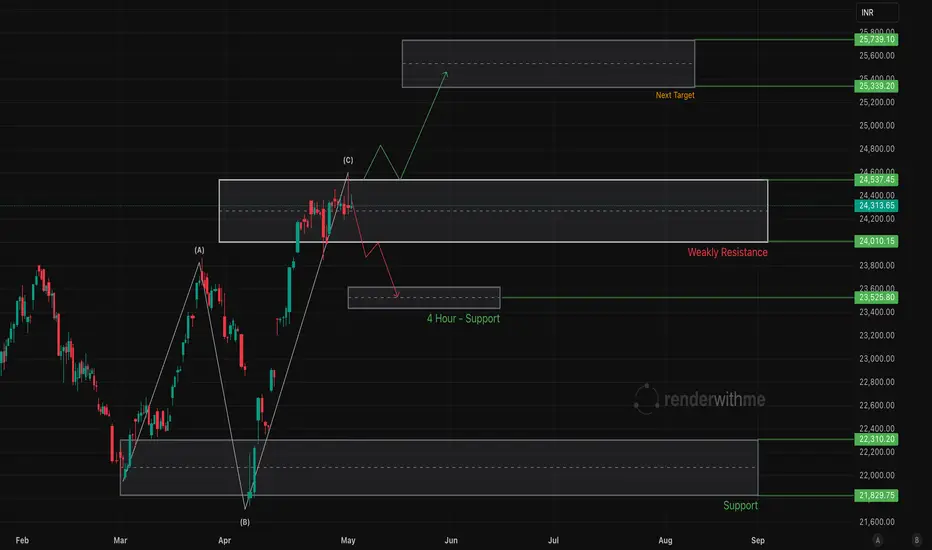
Current Levels and Trend: The Nifty 50 closed at 24,313 on May 2, 2025, reflecting a bullish trend with a 0.24% weekly gain, a 4.98% monthly increase, and a 7.88% yearly rise. The index is trading above key daily moving averages (5, 10, 20, 50, 100, and 200 DMA), signalling sustained bullish momentum.
Support and Resistance:
Support: Immediate support lies at 24,000–24,124, a strong demand zone on intraday and higher timeframes. A break and close of 4 hour candle below 24,000 could lead to a correction toward 23,500 or lower.
Resistance: The index faces resistance at 24,433–24,550. A decisive close above 24,600 could trigger a rally toward 25,300–25,700 or even 26,000
Volatility: Volatility is expected to persist due to global uncertainties and high VIX levels (above 18). Consolidation is likely unless the index decisively breaks 24,500.
Technical Analysis
Current Levels and Trend: The Nifty 50 closed at 24,313 on May 2, 2025, reflecting a bullish trend with a 0.24% weekly gain, a 4.98% monthly increase, and a 7.88% yearly rise. The index is trading above key daily moving averages (5, 10, 20, 50, 100, and 200 DMA), signalling sustained bullish momentum.
Support and Resistance:
Support: Immediate support lies at 24,000–24,124, a strong demand zone on intraday and higher timeframes. A break and close of 4 hour candle below 24,000 could lead to a correction toward 23,500 or lower.
Resistance: The index faces resistance at 24,433–24,550. A decisive close above 24,600 could trigger a rally toward 25,300–25,700 or even 26,000
Volatility: Volatility is expected to persist due to global uncertainties and high VIX levels (above 18). Consolidation is likely unless the index decisively breaks 24,500.
renderwithme
คำจำกัดสิทธิ์ความรับผิดชอบ
ข้อมูลและบทความไม่ได้มีวัตถุประสงค์เพื่อก่อให้เกิดกิจกรรมทางการเงิน, การลงทุน, การซื้อขาย, ข้อเสนอแนะ หรือคำแนะนำประเภทอื่น ๆ ที่ให้หรือรับรองโดย TradingView อ่านเพิ่มเติมที่ ข้อกำหนดการใช้งาน
renderwithme
คำจำกัดสิทธิ์ความรับผิดชอบ
ข้อมูลและบทความไม่ได้มีวัตถุประสงค์เพื่อก่อให้เกิดกิจกรรมทางการเงิน, การลงทุน, การซื้อขาย, ข้อเสนอแนะ หรือคำแนะนำประเภทอื่น ๆ ที่ให้หรือรับรองโดย TradingView อ่านเพิ่มเติมที่ ข้อกำหนดการใช้งาน