📊 Nifty Trading Plan – 22-May-2025
Chart Timeframe: 15 Min | Reference Price: 24,800
Gap Opening Threshold: 100+ points
🛡️ Risk Management Tips for Options Traders
✅ Avoid buying deep OTM options at the open; they lose premium fast if the move doesn't come immediately.
✅ Position sizing is key—never risk more than 1–2% of your capital on a single trade.
✅ Use Stop Loss based on spot level breakout/failure, not on premium value.
✅ Don't average losing trades. Wait for structure re-entry if SL hits.
✅ Trail your profits if in the green—book partials or move SL to cost to protect gains.
✅ Avoid trading first 15 minutes unless you're experienced in handling volatility.
📌 Summary & Conclusion
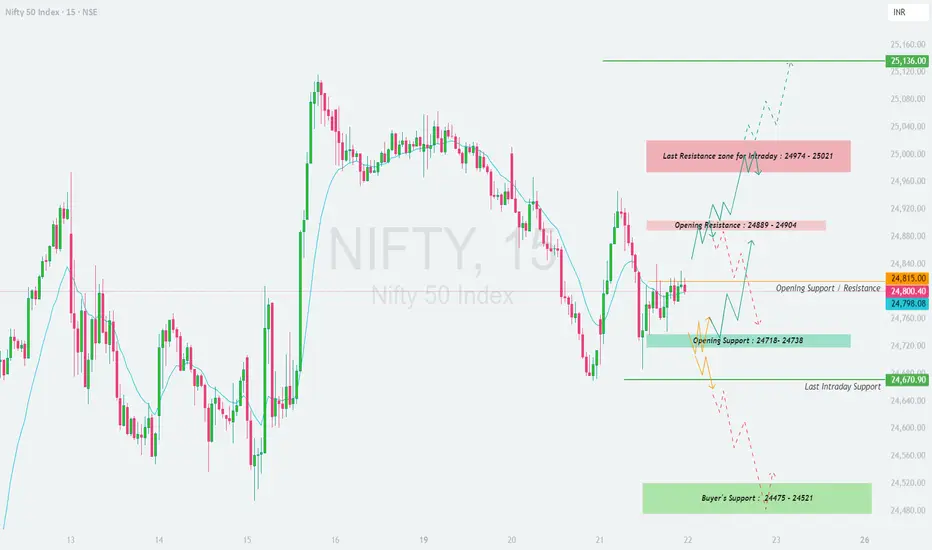
– Opening Resistance: 24,889 – 24,904
– Intraday Resistance: 24,974 – 25,021 | Final Target: 25,136
– Opening Support: 24,718 – 24,738 | Last Intraday Support: 24,670.90
– Major Buyer’s Support: 24,475 – 24,521
🎯 Key Idea: Trade the reaction at zones, not the prediction. Let the price action confirm your bias. Don’t rush into positions at the open—wait for confirmation to improve your risk-reward ratio.
⚠️ Disclaimer:
I am not a SEBI-registered analyst. This trading plan is shared for educational and informational purposes only. Please consult your financial advisor before making any investment or trading decisions.
Chart Timeframe: 15 Min | Reference Price: 24,800
Gap Opening Threshold: 100+ points
- 🚀 Gap-Up Opening (100+ Points Above Previous Close)
If Nifty opens above 24,900+, the price is likely to open directly inside or just below the Opening Resistance Zone: 24,889 – 24,904.
🟥 This is a supply area and could trigger initial selling if price shows signs of rejection (wicked candles, indecision). Traders must avoid chasing longs on open and instead wait for either a breakout or rejection.
✅ If price sustains above 24,904 with a strong bullish candle close (preferably 15min or 1hr), you can initiate long trades targeting the Intraday Resistance Zone: 24,974 – 25,021. If momentum continues, watch for a potential rally toward 25,136.
🔄 On the flip side, if the opening is followed by sharp rejection at 24,904 and the price falls back below 24,860, it may signal a failed breakout and can be a shorting opportunity back toward 24,800 and even the support zone at 24,738–24,718.
🎯 Plan of Action:
– Avoid impulsive longs at open.
– Long only on candle close above 24,904.
– Short if strong rejection appears and price falls below 24,860.
- 📈 Flat Opening (within ±100 Points)
If Nifty opens around 24,750 – 24,850, the price will be stuck between a crucial resistance (24,889–24,904) and support (24,738–24,718).
🟨 The initial price action will be range-bound. Let the market settle in the first 15–30 minutes and observe whether it breaks the upper resistance or support zones.
🟢 If price climbs and breaks 24,904 with a bullish confirmation candle, it opens the path to move higher toward 24,974 – 25,021, and eventually 25,136.
🟠 Conversely, if the price starts slipping below 24,718, and especially below 24,670.90 (last intraday support), sellers could gain control and drag the price toward the major demand zone 24,475 – 24,521 (Buyer's Support Zone).
🎯 Plan of Action:
– Wait for breakout from either 24,904 or breakdown below 24,718.
– Long trade setup above 24,904 with SL below breakout candle.
– Short setup below 24,718 with SL above breakdown candle.
- 📉 Gap-Down Opening (100+ Points Below Previous Close)
If Nifty opens around 24,650 or lower, it is opening directly near the Last Intraday Support: 24,670.90.
🟦 This support can trigger a bounce if defended, and could present a quick long trade back toward 24,718 – 24,738, possibly even 24,800 if momentum sustains.
🔻 However, if the price fails to hold this support and breaks below 24,670.90 early in the session, bears could take it down to the Buyer's Support Zone: 24,475 – 24,521.
📌 Watch this green zone for possible bottom-fishing or reversal setups, especially if there’s a bullish reversal candle with volume. Otherwise, a clean breakdown below 24,475 could extend selling pressure further.
🎯 Plan of Action:
– If support holds → Buy on bullish reversal with tight SL.
– If breakdown below 24,670 → Short with target 24,475 zone.
– Below 24,475 → Avoid bottom fishing unless confirmed reversal.
🛡️ Risk Management Tips for Options Traders
✅ Avoid buying deep OTM options at the open; they lose premium fast if the move doesn't come immediately.
✅ Position sizing is key—never risk more than 1–2% of your capital on a single trade.
✅ Use Stop Loss based on spot level breakout/failure, not on premium value.
✅ Don't average losing trades. Wait for structure re-entry if SL hits.
✅ Trail your profits if in the green—book partials or move SL to cost to protect gains.
✅ Avoid trading first 15 minutes unless you're experienced in handling volatility.
📌 Summary & Conclusion
– Opening Resistance: 24,889 – 24,904
– Intraday Resistance: 24,974 – 25,021 | Final Target: 25,136
– Opening Support: 24,718 – 24,738 | Last Intraday Support: 24,670.90
– Major Buyer’s Support: 24,475 – 24,521
🎯 Key Idea: Trade the reaction at zones, not the prediction. Let the price action confirm your bias. Don’t rush into positions at the open—wait for confirmation to improve your risk-reward ratio.
⚠️ Disclaimer:
I am not a SEBI-registered analyst. This trading plan is shared for educational and informational purposes only. Please consult your financial advisor before making any investment or trading decisions.
คำจำกัดสิทธิ์ความรับผิดชอบ
ข้อมูลและบทความไม่ได้มีวัตถุประสงค์เพื่อก่อให้เกิดกิจกรรมทางการเงิน, การลงทุน, การซื้อขาย, ข้อเสนอแนะ หรือคำแนะนำประเภทอื่น ๆ ที่ให้หรือรับรองโดย TradingView อ่านเพิ่มเติมใน ข้อกำหนดการใช้งาน
คำจำกัดสิทธิ์ความรับผิดชอบ
ข้อมูลและบทความไม่ได้มีวัตถุประสงค์เพื่อก่อให้เกิดกิจกรรมทางการเงิน, การลงทุน, การซื้อขาย, ข้อเสนอแนะ หรือคำแนะนำประเภทอื่น ๆ ที่ให้หรือรับรองโดย TradingView อ่านเพิ่มเติมใน ข้อกำหนดการใช้งาน