🔎 Market Structure Analysis (Multi-Timeframe)
4H Chart
Nifty has been in a rising channel since 29th August lows (~24,280).
Price is currently around 24,790, sitting at mid-channel support.
Multiple supply zones overhead:
24,850–24,900 (fresh supply, recent rejection).
25,000–25,050 (unfilled FVG + strong supply).
Demand zones:
24,700–24,720 (FVG + channel support).
24,550–24,580 (deeper demand zone).
Bias: 4H is still bullish-to-neutral, as long as price holds above 24,700. Break below 24,700 will turn structure weak.
1H Chart
Clear break of structure (BOS) upwards on 6th Sept.
Current pullback has respected 24,740–24,760 demand.
Liquidity was swept above 24,850, which aligns with rejection from supply.
Trendline support intact, but looks fragile.
Bias: 1H shows a short-term corrective pullback, but trend still points higher if demand holds.
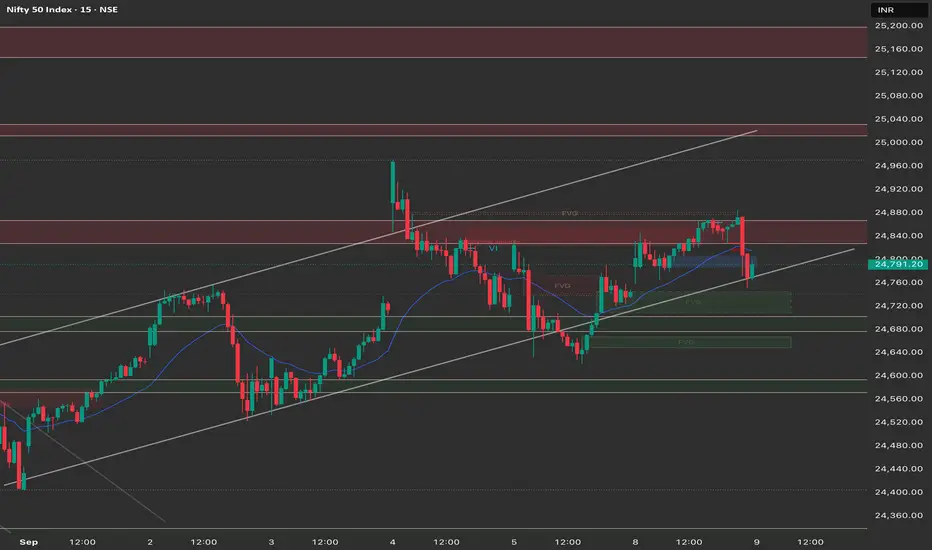
15M Chart
Market swept liquidity near 24,850, rejected hard, now consolidating.
Strong support forming near 24,730–24,750.
If broken, downside target = 24,650.
If defended, upside re-test of 24,850–24,900 possible.
Bias: Neutral, waiting for confirmation at 24,730 zone.
📌 Trade Plan for 9th September (Monday)
Bullish Scenario
Entry: Near 24,730–24,750 demand zone if defended with bullish candle.
SL: Below 24,680.
Targets:
T1 = 24,850 (previous supply).
T2 = 25,000–25,050 (major FVG & supply).
Bearish Scenario
Trigger: If price closes below 24,720 on 15M/1H.
Entry: Short on breakdown retest around 24,720–24,740.
SL: Above 24,800.
Targets:
T1 = 24,650 (first demand).
T2 = 24,560 (major demand).
Key Levels to Watch
24,850–24,900 → Supply rejection zone.
24,730–24,750 → Immediate demand & decision point.
24,650 / 24,560 → Next strong supports.
25,000–25,050 → Bullish target if demand holds.
✅ Summary:
Nifty is at a make-or-break zone near 24,750.
Hold = continuation towards 24,900–25,050.
Break = deeper pullback towards 24,650–24,560.
4H Chart
Nifty has been in a rising channel since 29th August lows (~24,280).
Price is currently around 24,790, sitting at mid-channel support.
Multiple supply zones overhead:
24,850–24,900 (fresh supply, recent rejection).
25,000–25,050 (unfilled FVG + strong supply).
Demand zones:
24,700–24,720 (FVG + channel support).
24,550–24,580 (deeper demand zone).
Bias: 4H is still bullish-to-neutral, as long as price holds above 24,700. Break below 24,700 will turn structure weak.
1H Chart
Clear break of structure (BOS) upwards on 6th Sept.
Current pullback has respected 24,740–24,760 demand.
Liquidity was swept above 24,850, which aligns with rejection from supply.
Trendline support intact, but looks fragile.
Bias: 1H shows a short-term corrective pullback, but trend still points higher if demand holds.
15M Chart
Market swept liquidity near 24,850, rejected hard, now consolidating.
Strong support forming near 24,730–24,750.
If broken, downside target = 24,650.
If defended, upside re-test of 24,850–24,900 possible.
Bias: Neutral, waiting for confirmation at 24,730 zone.
📌 Trade Plan for 9th September (Monday)
Bullish Scenario
Entry: Near 24,730–24,750 demand zone if defended with bullish candle.
SL: Below 24,680.
Targets:
T1 = 24,850 (previous supply).
T2 = 25,000–25,050 (major FVG & supply).
Bearish Scenario
Trigger: If price closes below 24,720 on 15M/1H.
Entry: Short on breakdown retest around 24,720–24,740.
SL: Above 24,800.
Targets:
T1 = 24,650 (first demand).
T2 = 24,560 (major demand).
Key Levels to Watch
24,850–24,900 → Supply rejection zone.
24,730–24,750 → Immediate demand & decision point.
24,650 / 24,560 → Next strong supports.
25,000–25,050 → Bullish target if demand holds.
✅ Summary:
Nifty is at a make-or-break zone near 24,750.
Hold = continuation towards 24,900–25,050.
Break = deeper pullback towards 24,650–24,560.
คำจำกัดสิทธิ์ความรับผิดชอบ
ข้อมูลและบทความไม่ได้มีวัตถุประสงค์เพื่อก่อให้เกิดกิจกรรมทางการเงิน, การลงทุน, การซื้อขาย, ข้อเสนอแนะ หรือคำแนะนำประเภทอื่น ๆ ที่ให้หรือรับรองโดย TradingView อ่านเพิ่มเติมที่ ข้อกำหนดการใช้งาน
คำจำกัดสิทธิ์ความรับผิดชอบ
ข้อมูลและบทความไม่ได้มีวัตถุประสงค์เพื่อก่อให้เกิดกิจกรรมทางการเงิน, การลงทุน, การซื้อขาย, ข้อเสนอแนะ หรือคำแนะนำประเภทอื่น ๆ ที่ให้หรือรับรองโดย TradingView อ่านเพิ่มเติมที่ ข้อกำหนดการใช้งาน