Friends I have made an visual representation of where the Nifty would be heading based on the
Method i follow as wave theory
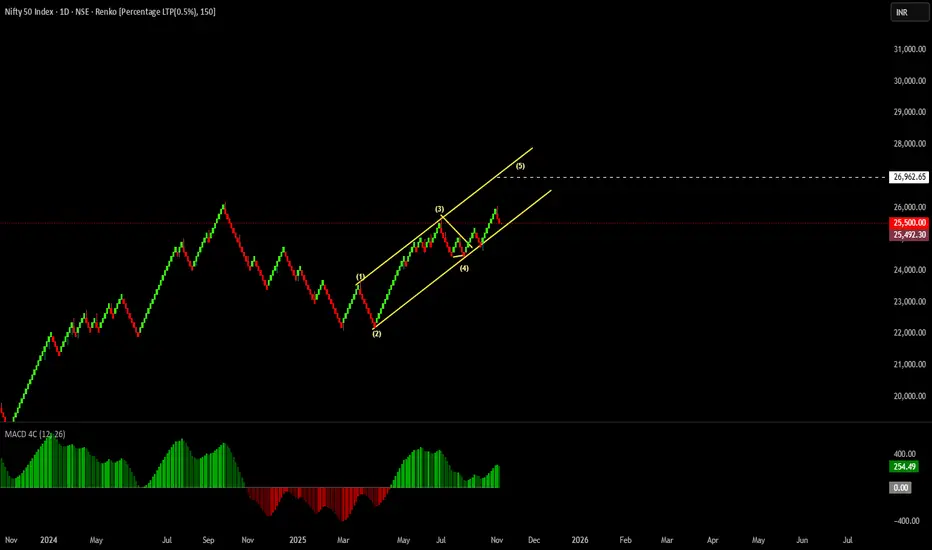
Interesting to note the price is in the channel or representation of channel fits the price movement
Also You can note i have selected 0.50 % Box size in Ranko Bars , which represents the movement in harmonic or linear movements based on fixed price bars
Now i have applied wave theory which represents the methods i follow as Analyst
Wave 2 Represents sharp correction
Wave 4 Represents Complex Running Flat Pattern leaving second leg correction fell short to represent the urgency in the Movement
Now I have forecasted it with mathematical calculations which may represents an measured move method to take Profits
All this is an education content
I hope you understand it and then hit the like button
Good luck
Method i follow as wave theory
Interesting to note the price is in the channel or representation of channel fits the price movement
Also You can note i have selected 0.50 % Box size in Ranko Bars , which represents the movement in harmonic or linear movements based on fixed price bars
Now i have applied wave theory which represents the methods i follow as Analyst
Wave 2 Represents sharp correction
Wave 4 Represents Complex Running Flat Pattern leaving second leg correction fell short to represent the urgency in the Movement
Now I have forecasted it with mathematical calculations which may represents an measured move method to take Profits
All this is an education content
I hope you understand it and then hit the like button
Good luck
การซื้อขายยังคงดำเนินอยู่
I did try to tell you that Majority of Market participents are looking for New highs , all you can do now is trail the stop on your holding in Nifty , Enjoy the ride คำจำกัดสิทธิ์ความรับผิดชอบ
ข้อมูลและบทความไม่ได้มีวัตถุประสงค์เพื่อก่อให้เกิดกิจกรรมทางการเงิน, การลงทุน, การซื้อขาย, ข้อเสนอแนะ หรือคำแนะนำประเภทอื่น ๆ ที่ให้หรือรับรองโดย TradingView อ่านเพิ่มเติมใน ข้อกำหนดการใช้งาน
คำจำกัดสิทธิ์ความรับผิดชอบ
ข้อมูลและบทความไม่ได้มีวัตถุประสงค์เพื่อก่อให้เกิดกิจกรรมทางการเงิน, การลงทุน, การซื้อขาย, ข้อเสนอแนะ หรือคำแนะนำประเภทอื่น ๆ ที่ให้หรือรับรองโดย TradingView อ่านเพิ่มเติมใน ข้อกำหนดการใช้งาน