[Most traders treat moving averages like magic buy/sell buttons.
That’s not how professionals think.
A moving average is a map of trend + structure, not a trading signal.
❌ The Retail Mistake
Buying when price crosses above
Selling when price crosses below.
Blindly trusting “golden cross” or “death cross.”
👉 Result: Whipsaws, fake entries, frustration.
✅ The Pro Mindset
Trend filter: Are we in uptrend (above MA), downtrend (below MA), or chop (whipsaw around MA)?
Dynamic support/resistance: Does price respect the MA and bounce, or reject and break?
Mean reversion tool: If price stretches too far from the MA, expect it to snap back.
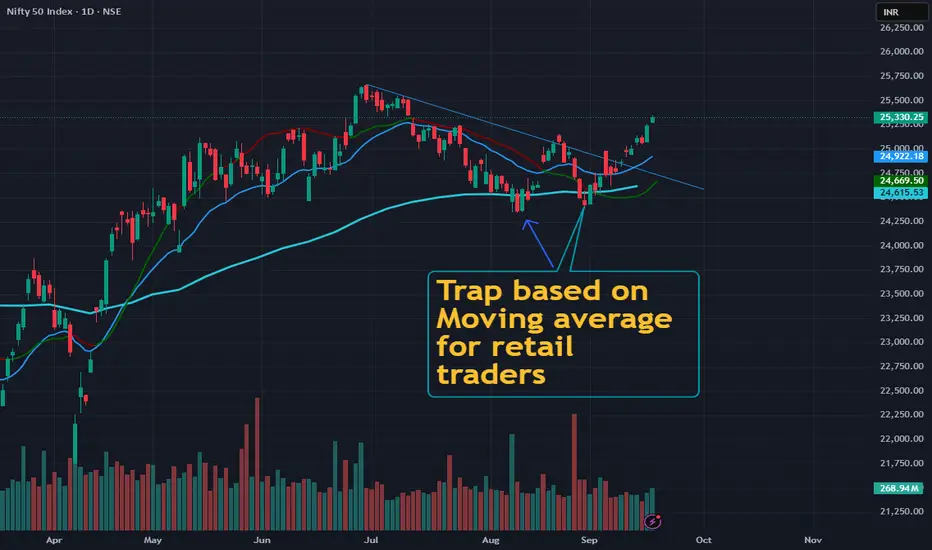
📊 In this NIFTY 50 chart:
April–June → Price rode the 50MA upward (dynamic support).
July–Aug → Price broke below → MA flipped into resistance.
Now → Price reclaiming above → shows buyers regaining control.
🎯 How You Can Use This
Use a 20/50/200 MA to filter trend → trade in the direction of bias.
Use MAs as areas of interest, not entry triggers. Wait for price reaction.
Don’t predict → let context confirm.
👉 Moving averages don’t predict. They contextualize.
Stop asking them for signals. Start using them as maps.
💡 Save this. Follow for daily trader mindset + real education — no fluff.
That’s not how professionals think.
A moving average is a map of trend + structure, not a trading signal.
❌ The Retail Mistake
Buying when price crosses above
Selling when price crosses below.
Blindly trusting “golden cross” or “death cross.”
👉 Result: Whipsaws, fake entries, frustration.
✅ The Pro Mindset
Trend filter: Are we in uptrend (above MA), downtrend (below MA), or chop (whipsaw around MA)?
Dynamic support/resistance: Does price respect the MA and bounce, or reject and break?
Mean reversion tool: If price stretches too far from the MA, expect it to snap back.
📊 In this NIFTY 50 chart:
April–June → Price rode the 50MA upward (dynamic support).
July–Aug → Price broke below → MA flipped into resistance.
Now → Price reclaiming above → shows buyers regaining control.
🎯 How You Can Use This
Use a 20/50/200 MA to filter trend → trade in the direction of bias.
Use MAs as areas of interest, not entry triggers. Wait for price reaction.
Don’t predict → let context confirm.
👉 Moving averages don’t predict. They contextualize.
Stop asking them for signals. Start using them as maps.
💡 Save this. Follow for daily trader mindset + real education — no fluff.
Started like everyone else — chasing trends, ignoring risk.
Learned the hard way that survival beats prediction.
Now I share structured equity views and hedged options plays using Renko and macro context — built for consistency, not dopamine.
Learned the hard way that survival beats prediction.
Now I share structured equity views and hedged options plays using Renko and macro context — built for consistency, not dopamine.
คำจำกัดสิทธิ์ความรับผิดชอบ
ข้อมูลและบทความไม่ได้มีวัตถุประสงค์เพื่อก่อให้เกิดกิจกรรมทางการเงิน, การลงทุน, การซื้อขาย, ข้อเสนอแนะ หรือคำแนะนำประเภทอื่น ๆ ที่ให้หรือรับรองโดย TradingView อ่านเพิ่มเติมใน ข้อกำหนดการใช้งาน