Identification:
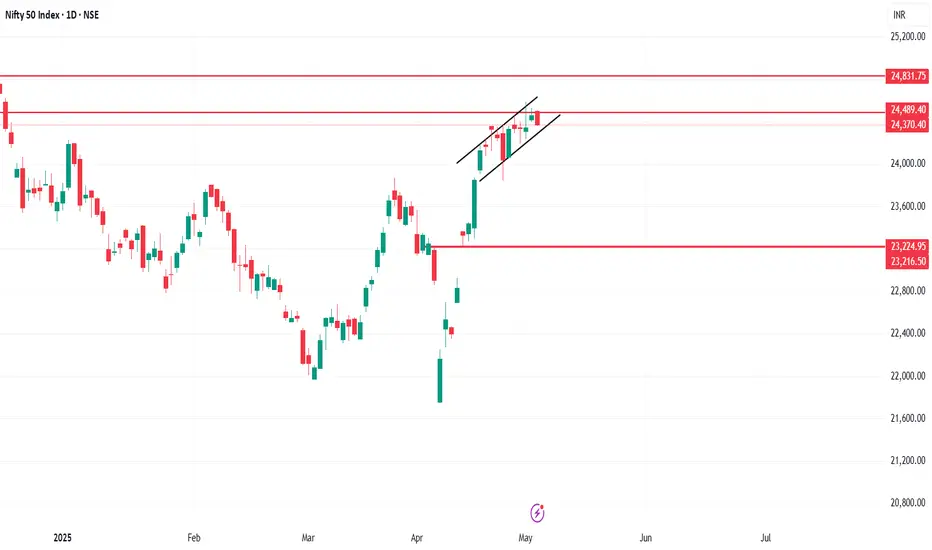
Both trendlines are sloping upwards, forming higher highs and higher lows.
The range is narrowing, with price moving within a converging upward channel.
This is typically considered a bearish reversal pattern, especially when it forms after an uptrend (as in this chart).
🔹 Implications:
If the price breaks down through the lower trendline, it may signal a short opportunity.
After a breakdown, the price target is usually equal to the height of the wedge (from the widest point).
Breakdown confirmation should ideally come with high volume.
🔹 Key Levels (from the chart):
Resistance zone: Around 24,489 – 24,831
Immediate support: Around 24,372 (horizontal)
Major support zone: Around 23,224 – 23,216
🔹 Possible Trade Setup (if breakdown happens):
Sell below: The lower wedge trendline (after candle closes below it)
Target levels: First target ~24,000, second target ~23,200
Stop loss: Just above the recent swing high or upper wedge line
only for educational purpos
คำจำกัดสิทธิ์ความรับผิดชอบ
ข้อมูลและบทความไม่ได้มีวัตถุประสงค์เพื่อก่อให้เกิดกิจกรรมทางการเงิน, การลงทุน, การซื้อขาย, ข้อเสนอแนะ หรือคำแนะนำประเภทอื่น ๆ ที่ให้หรือรับรองโดย TradingView อ่านเพิ่มเติมที่ ข้อกำหนดการใช้งาน
คำจำกัดสิทธิ์ความรับผิดชอบ
ข้อมูลและบทความไม่ได้มีวัตถุประสงค์เพื่อก่อให้เกิดกิจกรรมทางการเงิน, การลงทุน, การซื้อขาย, ข้อเสนอแนะ หรือคำแนะนำประเภทอื่น ๆ ที่ให้หรือรับรองโดย TradingView อ่านเพิ่มเติมที่ ข้อกำหนดการใช้งาน