📊 Current Snapshot
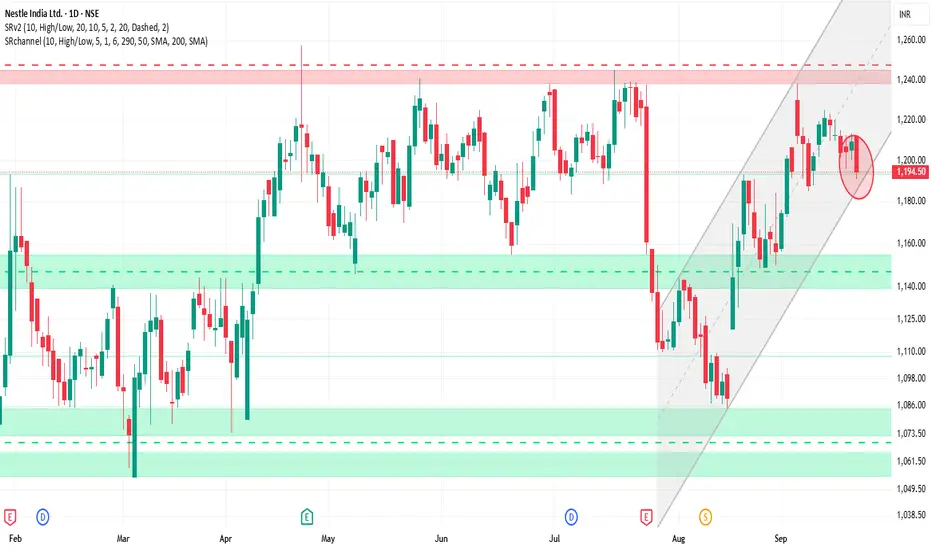
Closing Price: ₹1,194.50
Day’s Range: ₹1,190.20 – ₹1,212.00
52-Week Range: ₹1,055.00 – ₹1,389.00
Volume: Approximately 2.4 million shares traded
Market Cap: ₹2,30,337 Crores
P/E Ratio: 78.40 (reflecting premium valuation)
Dividend Yield: 2.26%
⚙️ Technical Indicators
Relative Strength Index (RSI): 47.51 – Neutral
Moving Average Convergence Divergence (MACD): -4.12 – Bearish
Moving Averages: Mixed signals; short-term averages above the current price, while long-term averages are below, indicating potential resistance.
Pivot Points: Central pivot around ₹1,194.73, suggesting a balanced market sentiment.
🎯 Potential Scenarios
Bullish Scenario: A breakout above ₹1,197.26 with strong volume could target ₹1,202.16 and higher levels.
Bearish Scenario: Failure to hold above ₹1,187.46 may lead to a decline toward ₹1,183.83.
⚠️ Key Considerations
Market Sentiment: Nestlé India has shown strong performance recently, but broader market conditions can impact its movement.
Volume Analysis: Watch for volume spikes to confirm breakout or breakdown signals.
Technical Indicators: While the RSI indicates a neutral stance, the MACD and moving averages suggest caution.
การนำเสนอที่เกี่ยวข้อง
คำจำกัดสิทธิ์ความรับผิดชอบ
ข้อมูลและบทความไม่ได้มีวัตถุประสงค์เพื่อก่อให้เกิดกิจกรรมทางการเงิน, การลงทุน, การซื้อขาย, ข้อเสนอแนะ หรือคำแนะนำประเภทอื่น ๆ ที่ให้หรือรับรองโดย TradingView อ่านเพิ่มเติมใน ข้อกำหนดการใช้งาน
การนำเสนอที่เกี่ยวข้อง
คำจำกัดสิทธิ์ความรับผิดชอบ
ข้อมูลและบทความไม่ได้มีวัตถุประสงค์เพื่อก่อให้เกิดกิจกรรมทางการเงิน, การลงทุน, การซื้อขาย, ข้อเสนอแนะ หรือคำแนะนำประเภทอื่น ๆ ที่ให้หรือรับรองโดย TradingView อ่านเพิ่มเติมใน ข้อกำหนดการใช้งาน