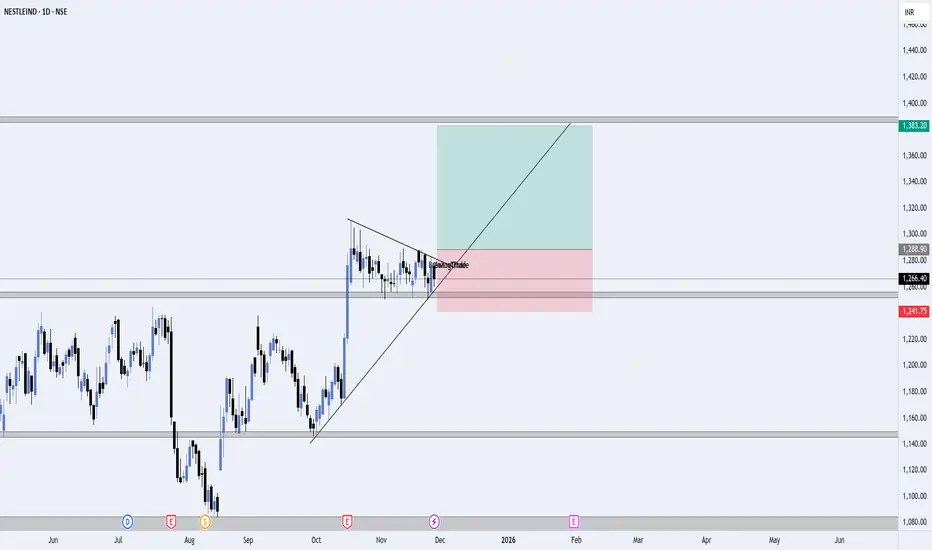
I’m watching Nestle India for a potential bullish breakout from a symmetrical triangle on the daily timeframe. Price has been consolidating after a strong impulsive move, and it is now respecting both trendline support and triangle resistance.
🔍 What I'm Seeing
Price created a strong rally, followed by a healthy consolidation.
A symmetrical triangle pattern has formed — showing tight price compression.
Price is currently sitting near the trendline support, indicating buyers are still active.
A breakout above the triangle could trigger the next bullish leg.
📈 Trade Idea
Entry Zone: Around current levels near the triangle breakout
Stop Loss: Placed below the trendline + recent swing lows
Target: Previous strong resistance zone near ₹1383
This gives a clean risk-to-reward setup with a logical structure: risk below support, target at the next major supply zone.
🎯 Why This Setup Makes Sense
Triangle breakout often leads to strong directional moves.
Trendline support confirms buyer strength.
Market structure is shifting bullish after breaking the downtrend earlier.
⚠️ Risk Note
This is not financial advice. Always manage risk properly and wait for a confirmed breakout candle before entering.
บันทึก
Wait for clear Breakout Candleปิดการเทรด ด้วยตนเอง
No Breakout Happend So pending order not executedคำจำกัดสิทธิ์ความรับผิดชอบ
ข้อมูลและบทความไม่ได้มีวัตถุประสงค์เพื่อก่อให้เกิดกิจกรรมทางการเงิน, การลงทุน, การซื้อขาย, ข้อเสนอแนะ หรือคำแนะนำประเภทอื่น ๆ ที่ให้หรือรับรองโดย TradingView อ่านเพิ่มเติมใน ข้อกำหนดการใช้งาน
คำจำกัดสิทธิ์ความรับผิดชอบ
ข้อมูลและบทความไม่ได้มีวัตถุประสงค์เพื่อก่อให้เกิดกิจกรรมทางการเงิน, การลงทุน, การซื้อขาย, ข้อเสนอแนะ หรือคำแนะนำประเภทอื่น ๆ ที่ให้หรือรับรองโดย TradingView อ่านเพิ่มเติมใน ข้อกำหนดการใช้งาน