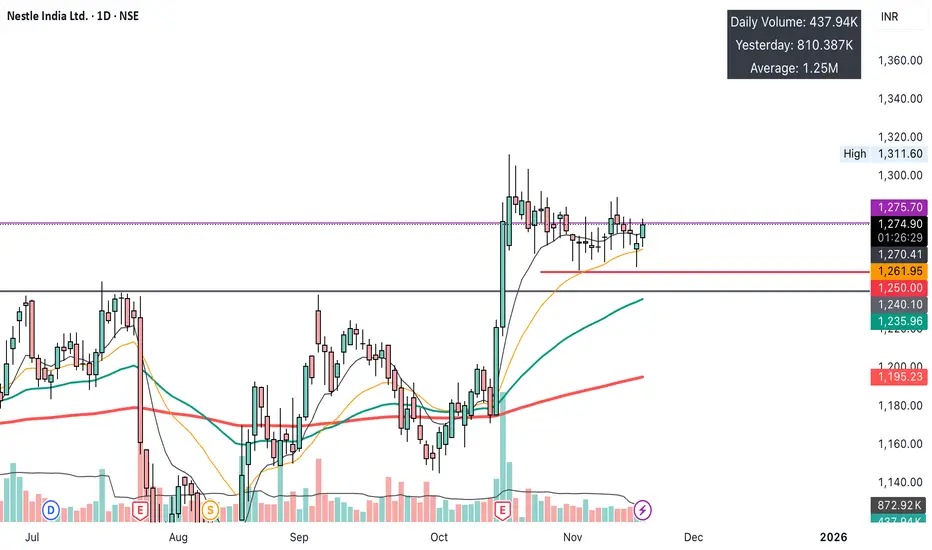
This is a live swing trade I am taking in $NESTLEIND. The stock surged in late October and has since consolidated in a "High Tight Flag," refusing to give back gains. It is now breaking out.
This post details the *full* mechanical framework I am using to manage this trade.
### 1. Indicators Used on This Chart
* **9 EMA (thin black line):** Short-term momentum.
* **21 EMA (thin orange line):** Acts as dynamic support and my trailing stop for the runner.
* **50 EMA (green line):** Medium-term trend.
* **200 EMA (red line):** Long-term uptrend confirmation.
* **Volume:** Confirming the breakout.
### 2. Decoding the Setup
1. **The Pop:** A massive vertical move in late October showed a change in character.
2. **The Flag:** The stock consolidated sideways, "surfing" the **21 EMA**, proving strong demand.
3. **The Breakout:** Today, price is pushing above the `₹1,276.70` resistance.
### 3. The Mechanical Trade Plan (The "Swing" Playbook)
This is a cash "Swing" trade.
* **Bias:** Long
* **Entry:** `₹1,276.70`
* **Stop-Loss (1R):** **`₹1,250.00`** (Placed below the consolidation low and psychological level)
* **Risk:** My risk is fixed at **`₹26.70`** per share (2.09%). Position is sized to my standard 1R.
### 4. Our Exit Strategy (The "2R / 21EMA Hybrid")
1. **Target 1 (Base Hit):** Sell **50% of the position at +2R.**
* **2R Target = ~₹1,330.10**
2. **The "Free Trade" Maneuver:** Once Target 1 is hit, stop-loss on the remaining 50% moves to **Breakeven (`₹1,276.70`).**
3. **Target 2 (The Runner):** I will trail the remaining "free" position using the **21 EMA** to catch the trend.
*Disclaimer: This is not financial advice. This is my personal trade journal and framework, shared for educational and analytical purposes only. Always do your own research.*
คำจำกัดสิทธิ์ความรับผิดชอบ
ข้อมูลและบทความไม่ได้มีวัตถุประสงค์เพื่อก่อให้เกิดกิจกรรมทางการเงิน, การลงทุน, การซื้อขาย, ข้อเสนอแนะ หรือคำแนะนำประเภทอื่น ๆ ที่ให้หรือรับรองโดย TradingView อ่านเพิ่มเติมใน ข้อกำหนดการใช้งาน
คำจำกัดสิทธิ์ความรับผิดชอบ
ข้อมูลและบทความไม่ได้มีวัตถุประสงค์เพื่อก่อให้เกิดกิจกรรมทางการเงิน, การลงทุน, การซื้อขาย, ข้อเสนอแนะ หรือคำแนะนำประเภทอื่น ๆ ที่ให้หรือรับรองโดย TradingView อ่านเพิ่มเติมใน ข้อกำหนดการใช้งาน