تم ابتكار هذه الطريقة شخصيًا عبر بحث وتجربة طويلة، وهي تعتمد على مبدأ "الأكوان الزمنية" والمدارات السعرية، بشكل لم يسبق طرحه أو استخدامه من قبل في التحليل الفني التقليدي.
هذه الرؤية تكشف المسار الطويل الأمد للسوق، ليس فقط عبر خطوط دعم ومقاومة، بل عبر دورات كونية كاملة توضح نهايات المراحل الاقتصادية وبداياتها.
الرسم يوضح أن ناسداك قد أكمل دورة زمنية كبرى، ومعطيات الكون الجديد تُشير إلى احتمالية دخول السوق في تصحيح عميق مستمر على مدى سنوات قادمة.
هذه القراءة ليست توصية استثمارية، بل عرض فكري لطريقة تحليل غير معروفة ومبنية على تصور خاص لحركة الزمن والأسواق المالية.
This method was personally developed through extensive research and experimentation.
It is based on the principle of "Temporal Universes" and price orbits, a concept that has not been introduced or used before in traditional technical analysis.
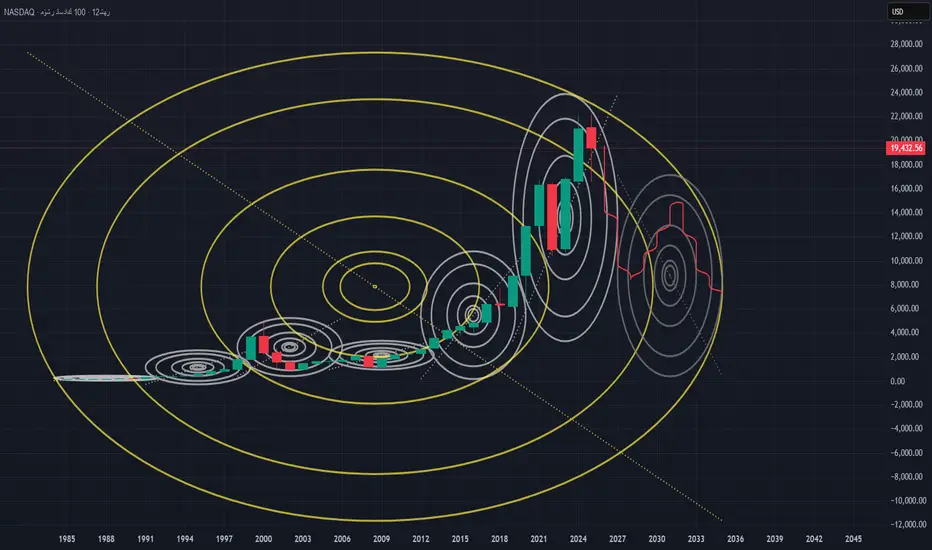
This vision reveals the long-term trajectory of the market — not just through support and resistance lines, but through complete cosmic cycles that highlight the endings and beginnings of major economic phases.
The chart illustrates that the Nasdaq has completed a major temporal cycle, and the structure of the new universe suggests a potential entry into a prolonged deep correction over the coming years.
This analysis is not an investment recommendation, but rather an intellectual presentation of an unknown analytical approach built upon a unique perception of time and market dynamics.
هذه الرؤية تكشف المسار الطويل الأمد للسوق، ليس فقط عبر خطوط دعم ومقاومة، بل عبر دورات كونية كاملة توضح نهايات المراحل الاقتصادية وبداياتها.
الرسم يوضح أن ناسداك قد أكمل دورة زمنية كبرى، ومعطيات الكون الجديد تُشير إلى احتمالية دخول السوق في تصحيح عميق مستمر على مدى سنوات قادمة.
هذه القراءة ليست توصية استثمارية، بل عرض فكري لطريقة تحليل غير معروفة ومبنية على تصور خاص لحركة الزمن والأسواق المالية.
This method was personally developed through extensive research and experimentation.
It is based on the principle of "Temporal Universes" and price orbits, a concept that has not been introduced or used before in traditional technical analysis.
This vision reveals the long-term trajectory of the market — not just through support and resistance lines, but through complete cosmic cycles that highlight the endings and beginnings of major economic phases.
The chart illustrates that the Nasdaq has completed a major temporal cycle, and the structure of the new universe suggests a potential entry into a prolonged deep correction over the coming years.
This analysis is not an investment recommendation, but rather an intellectual presentation of an unknown analytical approach built upon a unique perception of time and market dynamics.
คำจำกัดสิทธิ์ความรับผิดชอบ
ข้อมูลและบทความไม่ได้มีวัตถุประสงค์เพื่อก่อให้เกิดกิจกรรมทางการเงิน, การลงทุน, การซื้อขาย, ข้อเสนอแนะ หรือคำแนะนำประเภทอื่น ๆ ที่ให้หรือรับรองโดย TradingView อ่านเพิ่มเติมใน ข้อกำหนดการใช้งาน
คำจำกัดสิทธิ์ความรับผิดชอบ
ข้อมูลและบทความไม่ได้มีวัตถุประสงค์เพื่อก่อให้เกิดกิจกรรมทางการเงิน, การลงทุน, การซื้อขาย, ข้อเสนอแนะ หรือคำแนะนำประเภทอื่น ๆ ที่ให้หรือรับรองโดย TradingView อ่านเพิ่มเติมใน ข้อกำหนดการใช้งาน