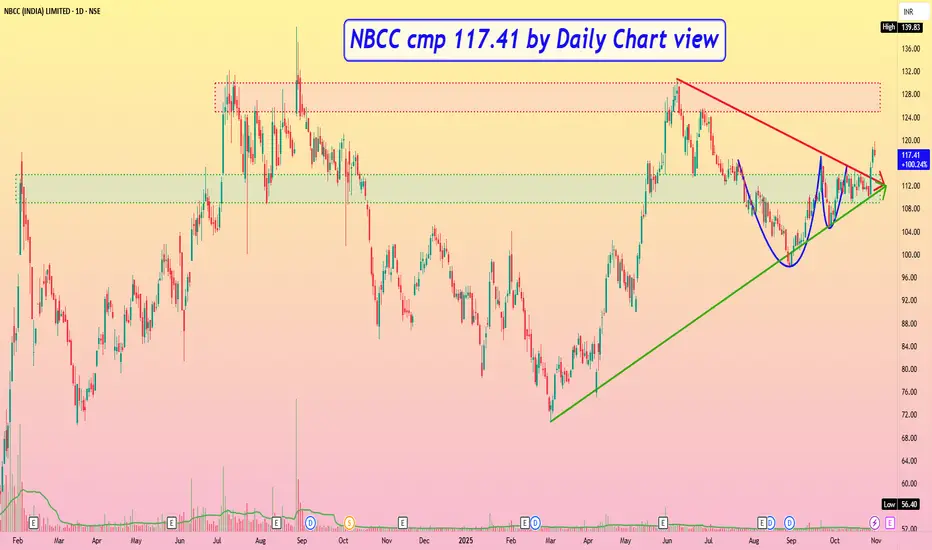
NBCC cmp 117.41 by Daily Chart view
* Support Zone 109 to 114 Price Band
* Resistance Zone 125 to 130 Price Band then 137 to ATH 139.83
* Bullish Cup and Handle pattern is made around the Support Zone
* Symmetrical Triangle pattern breakout seems to be in making process
* Volumes in good sync with avg traded quantity and spiking above it too
* Falling Resistance Trendline Breakout with Rising Support Trendline well respected
คำจำกัดสิทธิ์ความรับผิดชอบ
ข้อมูลและบทความไม่ได้มีวัตถุประสงค์เพื่อก่อให้เกิดกิจกรรมทางการเงิน, การลงทุน, การซื้อขาย, ข้อเสนอแนะ หรือคำแนะนำประเภทอื่น ๆ ที่ให้หรือรับรองโดย TradingView อ่านเพิ่มเติมใน ข้อกำหนดการใช้งาน
คำจำกัดสิทธิ์ความรับผิดชอบ
ข้อมูลและบทความไม่ได้มีวัตถุประสงค์เพื่อก่อให้เกิดกิจกรรมทางการเงิน, การลงทุน, การซื้อขาย, ข้อเสนอแนะ หรือคำแนะนำประเภทอื่น ๆ ที่ให้หรือรับรองโดย TradingView อ่านเพิ่มเติมใน ข้อกำหนดการใช้งาน