Two Precision Setups for a Major Move | Breakout vs. Rebound
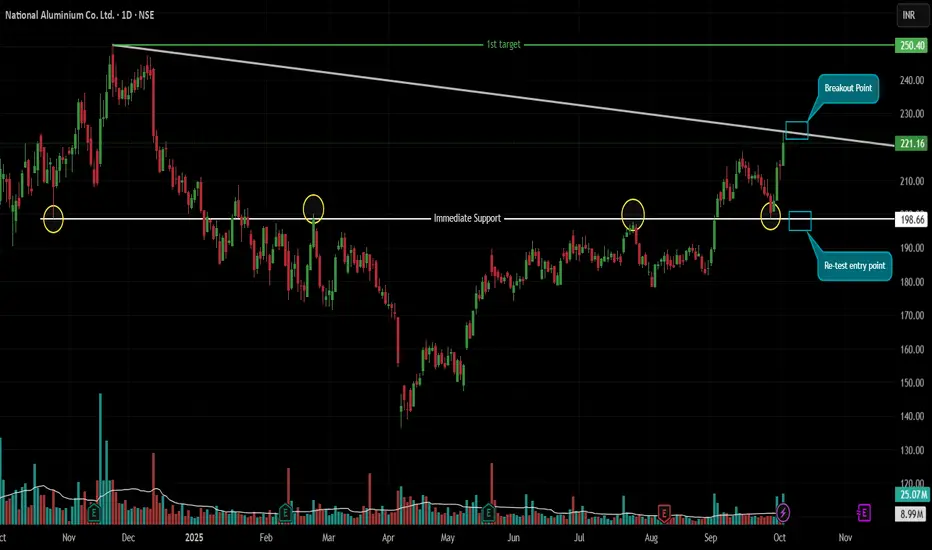
Chart: NSE:NALCO | Daily Timeframe
📈 Executive Summary:
Nalco Ltd. is at a technical crossroads, compressed between a massive 12-month descending trendline and a rock-solid multi-touch support zone. This creates two high-probability, well-defined trading opportunities for both momentum and value traders. The key for both setups will be confirmation with above-average volume.
🔥 Scenario 1: The Mega Breakout (Momentum Play)
This setup capitalizes on a decisive shift in long-term trend dynamics.
The Structure: A dominant Descending Trendline connects the November 2024 high (₹250) with the recent October 2025 high (₹225). This line has contained all major rallies for nearly a year.
The Trigger & Confirmation: A strong, 'big green' daily candle that closes decisively above ₹225. This move must be supported by above-average volume to confirm genuine buying interest and not a false breakout.
The Logic: A breakout from such a long-standing consolidation has the potential to unleash significant pent-up momentum, targeting the previous major high.
🎯 Trading Plan (Breakout):
🎯 Entry: On a daily close above ₹225, confirmed by above-average volume.
⛔ Stop Loss: Low of the breakout candle. This pragmatic level protects against a false breakout and allows for a tight, logical risk definition.
🎯 Target: ₹250 (The origin point of the trendline, acting as a logical and psychological target).
⚖️ Risk-Reward: Highly favorable, estimated above 1:3.
🛡️ Scenario 2: The Support Bounce (Value Play)
This is a classic "buy low, sell high" strategy at a proven demand zone.
The Structure: The ₹199 level is a historic support and resistance zone, tested multiple times since October 2024. It currently acts as a strong support floor.
The Trigger & Confirmation: The price must retrace and hold the ₹199-202 zone and then form a clear bullish reversal candlestick pattern (e.g., Hammer, Bullish Engulfing) with above-average volume on the daily timeframe.
The Logic: Entering at a proven support level with a candlestick confirmation provides a high-probability entry with an excellent risk-to-reward profile.
🎯 Trading Plan (Support Bounce):
🎯 Entry: On the confirmation of the bullish candlestick pattern (e.g., a close above the high of the pattern's candle) in the ₹199-202 zone, with volume confirmation.
⛔ Stop Loss: Low of the identified reversal candlestick pattern. This minimizes risk by invalidating the setup if the support fails immediately.
🎯 Target 1: 1:1 Risk-Reward Level (e.g., if risk is ₹5, target is Entry + ₹5).
🎯 Target 2: ₹225 (The recent swing high and trendline resistance). Once Target 1 is hit, trail the stop loss to lock in profits and ride the move towards ₹225.
Key Levels At a Glance:
All-Out Resistance: ₹225 (The 12-Month Trendline)
Foundational Support: ₹199 (The Multi-Touch Zone)
Breakout Target: ₹250
Support Bounce Target: ₹210-225
Final Note: Both setups require patience and discipline. Wait for the specific trigger and volume confirmation. Do not pre-empt the trade.
Disclaimer: This idea represents a technical analysis perspective and is not financial advice. All trading decisions carry risk. Please perform your own due diligence.
คำจำกัดสิทธิ์ความรับผิดชอบ
ข้อมูลและบทความไม่ได้มีวัตถุประสงค์เพื่อก่อให้เกิดกิจกรรมทางการเงิน, การลงทุน, การซื้อขาย, ข้อเสนอแนะ หรือคำแนะนำประเภทอื่น ๆ ที่ให้หรือรับรองโดย TradingView อ่านเพิ่มเติมที่ ข้อกำหนดการใช้งาน
คำจำกัดสิทธิ์ความรับผิดชอบ
ข้อมูลและบทความไม่ได้มีวัตถุประสงค์เพื่อก่อให้เกิดกิจกรรมทางการเงิน, การลงทุน, การซื้อขาย, ข้อเสนอแนะ หรือคำแนะนำประเภทอื่น ๆ ที่ให้หรือรับรองโดย TradingView อ่านเพิ่มเติมที่ ข้อกำหนดการใช้งาน