The market today is exhibiting a bearish bias for the technology-heavy NASDAQ (COMP) driven by a confluence of macroeconomic and technical factors.
Macroeconomic Headwinds: "Higher-For-Longer" Rates
The primary bearish catalyst is the sustained upward trajectory in long-term Treasury yields. High yields pressure growth and technology stocks, which comprise the bulk of the NASDAQ. Higher borrowing costs diminish the value of future earnings (discounted cash flow) for companies that rely on debt for aggressive growth, leading to multiple compression across the tech sector. This underlying fear of sustained high interest rates is keeping institutional capital cautious.
Geopolitical Instability and Risk-Off Sentiment
Escalating geopolitical tensions have introduced significant market uncertainty. While a direct economic impact is hard to quantify immediately, such events typically trigger a "flight to safety," with investors pulling money out of riskier, high-growth assets (like tech stocks) and into traditional safe-haven assets, pressuring the NASDAQ.
Technical Breakdown
Trend and Structure
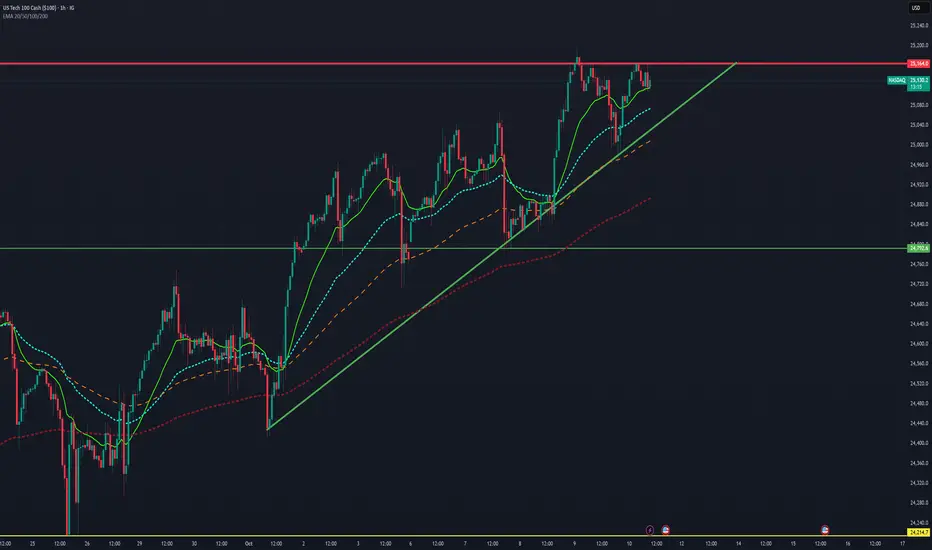
The index exhibits a clear intraday uptrend , characterized by higher highs and higher lows.
A prominent rising green trendline acts as strong dynamic support, connecting the recent significant low points. The price has respected this trendline repeatedly, indicating bullish momentum.
The overall pattern on the right side of the chart appears to be forming an ascending triangle pattern, a continuation pattern that often resolves to the upside, though a breakout confirmation is required.
Key Price Levels
Resistance: The most critical level is the horizontal red resistance line at approximately 25,160.0. The price is currently challenging this level and has touched it multiple times without a decisive breakout to new highs. A confirmed break above this level would signal a continuation of the rally.
Support:
Dynamic Support: The rising green trendline provides immediate support. A break below this line would be the first sign of a significant shift in intraday momentum.
Key Support Zone: A visible support area is marked by a horizontal green line at approximately 24,790.0, which served as a previous reaction level before the final push higher.
Indicators (Moving Averages)
The chart shows several Moving Averages (MAs), which generally support the current bullish trend, as the price remains above all displayed MAs:
The price is trading well above the short-term MAs (solid light green and light blue lines), suggesting strong current bullish momentum.
The MAs themselves are generally sloping upwards and are in a bullish order (shorter-term MAs above longer-term MAs), which reinforces the current strength. A close below these moving averages, particularly the longer-term dashed ones, would indicate a decline in buying pressure.
Momentum Observation
The price action near the high suggests a slight loss of upside momentum, evidenced by the multiple attempts to break the 25,140.0 resistance without success. This could be interpreted as:
Consolidation before a potential breakout above the resistance.
A possible formation of a double top or exhaustion if the price fails to break resistance and subsequently breaks the rising trendline.
Macroeconomic Headwinds: "Higher-For-Longer" Rates
The primary bearish catalyst is the sustained upward trajectory in long-term Treasury yields. High yields pressure growth and technology stocks, which comprise the bulk of the NASDAQ. Higher borrowing costs diminish the value of future earnings (discounted cash flow) for companies that rely on debt for aggressive growth, leading to multiple compression across the tech sector. This underlying fear of sustained high interest rates is keeping institutional capital cautious.
Geopolitical Instability and Risk-Off Sentiment
Escalating geopolitical tensions have introduced significant market uncertainty. While a direct economic impact is hard to quantify immediately, such events typically trigger a "flight to safety," with investors pulling money out of riskier, high-growth assets (like tech stocks) and into traditional safe-haven assets, pressuring the NASDAQ.
Technical Breakdown
Trend and Structure
The index exhibits a clear intraday uptrend , characterized by higher highs and higher lows.
A prominent rising green trendline acts as strong dynamic support, connecting the recent significant low points. The price has respected this trendline repeatedly, indicating bullish momentum.
The overall pattern on the right side of the chart appears to be forming an ascending triangle pattern, a continuation pattern that often resolves to the upside, though a breakout confirmation is required.
Key Price Levels
Resistance: The most critical level is the horizontal red resistance line at approximately 25,160.0. The price is currently challenging this level and has touched it multiple times without a decisive breakout to new highs. A confirmed break above this level would signal a continuation of the rally.
Support:
Dynamic Support: The rising green trendline provides immediate support. A break below this line would be the first sign of a significant shift in intraday momentum.
Key Support Zone: A visible support area is marked by a horizontal green line at approximately 24,790.0, which served as a previous reaction level before the final push higher.
Indicators (Moving Averages)
The chart shows several Moving Averages (MAs), which generally support the current bullish trend, as the price remains above all displayed MAs:
The price is trading well above the short-term MAs (solid light green and light blue lines), suggesting strong current bullish momentum.
The MAs themselves are generally sloping upwards and are in a bullish order (shorter-term MAs above longer-term MAs), which reinforces the current strength. A close below these moving averages, particularly the longer-term dashed ones, would indicate a decline in buying pressure.
Momentum Observation
The price action near the high suggests a slight loss of upside momentum, evidenced by the multiple attempts to break the 25,140.0 resistance without success. This could be interpreted as:
Consolidation before a potential breakout above the resistance.
A possible formation of a double top or exhaustion if the price fails to break resistance and subsequently breaks the rising trendline.
การนำเสนอที่เกี่ยวข้อง
คำจำกัดสิทธิ์ความรับผิดชอบ
ข้อมูลและบทความไม่ได้มีวัตถุประสงค์เพื่อก่อให้เกิดกิจกรรมทางการเงิน, การลงทุน, การซื้อขาย, ข้อเสนอแนะ หรือคำแนะนำประเภทอื่น ๆ ที่ให้หรือรับรองโดย TradingView อ่านเพิ่มเติมที่ ข้อกำหนดการใช้งาน
การนำเสนอที่เกี่ยวข้อง
คำจำกัดสิทธิ์ความรับผิดชอบ
ข้อมูลและบทความไม่ได้มีวัตถุประสงค์เพื่อก่อให้เกิดกิจกรรมทางการเงิน, การลงทุน, การซื้อขาย, ข้อเสนอแนะ หรือคำแนะนำประเภทอื่น ๆ ที่ให้หรือรับรองโดย TradingView อ่านเพิ่มเติมที่ ข้อกำหนดการใช้งาน