🚀 NASDAQ100 / US100 Index – Thief Money Heist Plan 🎭
📌 Plan: Bullish Swing / Scalping Setup
Dear Ladies & Gentlemen (Thief OG’s), here’s the heist-style breakdown for US100 🔑:
🏴☠️ Entry Style (Thief Layering Strategy)
Using layered limit orders for flexibility & precision:
• 23200.0
• 23250.0
• 23300.0
• 23350.0
(You may increase limit layers based on your strategy & risk appetite)
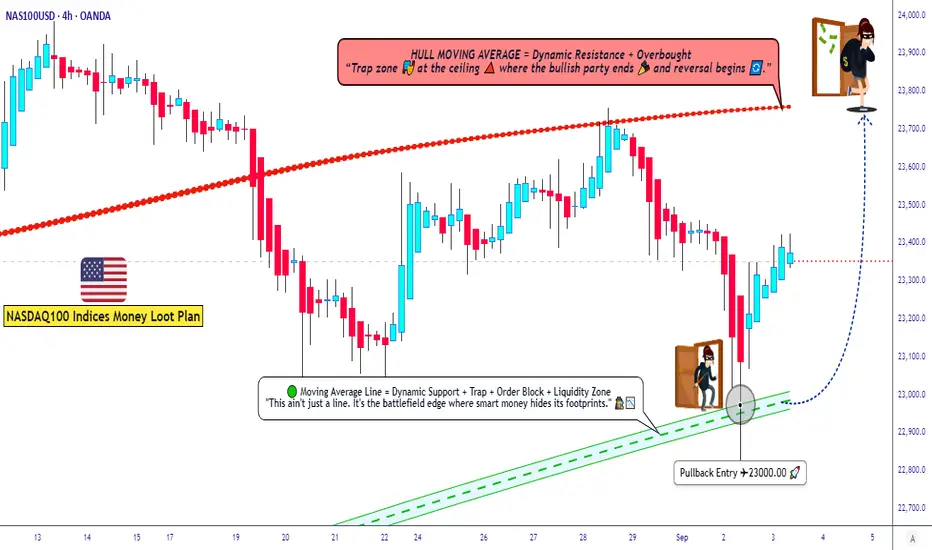
📉 Moving Average Pullback Entry Plan
• Buy entries on pullbacks to the Fibo level 382 Triangular Moving average zone.
• Look for bullish candles confirming the bounce from these MAs.
• This offers better risk-to-reward by catching momentum on retracements instead of chasing highs.
❓ Why This Works?
• Moving averages often act as dynamic support/resistance in trending markets.
• Institutional traders & algos track them heavily, making them high-probability zones.
• Combining with layering entries = higher flexibility + reduced risk of mistimed single entry.
🛡️ Stop Loss (Protect the Vault)
• Thief SL: @23000.0
• Reminder: Adjust your SL based on your own strategy & risk tolerance.
🎯 Target (Escape Zone)
• Overbought + Trap Zone ahead!
• Escape target: @23750.0
• Note: Don’t rely only on my TP — secure profits at your own pace and risk.
📊 US100 Index CFD Real-Time Data Sep 03
📈 Daily Change: +133.47 (+0.57%)
📅 Monthly Performance: +0.76%
📆 Yearly Performance: +23.48%
😰😊 Fear & Greed Index
📊 Current Reading: 53/100 (Neutral)
🧐 Interpretation: Market sentiment is balanced, showing neither extreme fear nor greed. Investors are cautious but not panicked.
🧠 Retail vs. Institutional Sentiment
👥 Retail Traders: Moderately bullish (55% Long, 45% Short)
🏦 Institutional Traders: Slightly cautious (50% Long, 50% Short)
🔑 Key Drivers: Mixed signals from manufacturing data and upcoming labor market reports.
📉📈 Fundamental & Macro Score
📊 Macro Score: 6/10
Manufacturing PMI (48.7) still in contraction but improving.
Labor market data (JOLTS) awaited for clarity.
⚡ Volatility Score: 5/10 (Moderate)
VIX near average levels, indicating stable expectations.
💧 Liquidity Score: 7/10
Strong volume and breadth in large-cap tech stocks.
🐂🐻 Overall Market Outlook
✅ Bullish (Long): 60%
Supported by strong yearly gains and resilience in big tech.
⚠️ Bearish (Short): 40%
Concerns over manufacturing contraction and inflation pressures.
💡 Key Takeaways
📈 US100 is trending mildly positive today (+0.57%).
😐 Sentiment is neutral—no extreme fear or greed.
📊 Macro data hints at cautious optimism but watch for upcoming labor reports.
🐂 Overall bias leans slightly bullish for long-term holders.
📊 Related Pairs to Watch
 SPX500
 DJI
DJI
 VIX
VIX
 NDX
NDX
 USDOLLAR
✨ “If you find value in my analysis, a 👍 and 🚀 boost is much appreciated — it helps me share more setups with the community!”
#NASDAQ100 #US100 #NDX #SPX500 #DJI #TradingView #SwingTrade #ScalpTrading #LayeringStrategy #MarketAnalysis
📌 Plan: Bullish Swing / Scalping Setup
Dear Ladies & Gentlemen (Thief OG’s), here’s the heist-style breakdown for US100 🔑:
🏴☠️ Entry Style (Thief Layering Strategy)
Using layered limit orders for flexibility & precision:
• 23200.0
• 23250.0
• 23300.0
• 23350.0
(You may increase limit layers based on your strategy & risk appetite)
📉 Moving Average Pullback Entry Plan
• Buy entries on pullbacks to the Fibo level 382 Triangular Moving average zone.
• Look for bullish candles confirming the bounce from these MAs.
• This offers better risk-to-reward by catching momentum on retracements instead of chasing highs.
❓ Why This Works?
• Moving averages often act as dynamic support/resistance in trending markets.
• Institutional traders & algos track them heavily, making them high-probability zones.
• Combining with layering entries = higher flexibility + reduced risk of mistimed single entry.
🛡️ Stop Loss (Protect the Vault)
• Thief SL: @23000.0
• Reminder: Adjust your SL based on your own strategy & risk tolerance.
🎯 Target (Escape Zone)
• Overbought + Trap Zone ahead!
• Escape target: @23750.0
• Note: Don’t rely only on my TP — secure profits at your own pace and risk.
📊 US100 Index CFD Real-Time Data Sep 03
📈 Daily Change: +133.47 (+0.57%)
📅 Monthly Performance: +0.76%
📆 Yearly Performance: +23.48%
😰😊 Fear & Greed Index
📊 Current Reading: 53/100 (Neutral)
🧐 Interpretation: Market sentiment is balanced, showing neither extreme fear nor greed. Investors are cautious but not panicked.
🧠 Retail vs. Institutional Sentiment
👥 Retail Traders: Moderately bullish (55% Long, 45% Short)
🏦 Institutional Traders: Slightly cautious (50% Long, 50% Short)
🔑 Key Drivers: Mixed signals from manufacturing data and upcoming labor market reports.
📉📈 Fundamental & Macro Score
📊 Macro Score: 6/10
Manufacturing PMI (48.7) still in contraction but improving.
Labor market data (JOLTS) awaited for clarity.
⚡ Volatility Score: 5/10 (Moderate)
VIX near average levels, indicating stable expectations.
💧 Liquidity Score: 7/10
Strong volume and breadth in large-cap tech stocks.
🐂🐻 Overall Market Outlook
✅ Bullish (Long): 60%
Supported by strong yearly gains and resilience in big tech.
⚠️ Bearish (Short): 40%
Concerns over manufacturing contraction and inflation pressures.
💡 Key Takeaways
📈 US100 is trending mildly positive today (+0.57%).
😐 Sentiment is neutral—no extreme fear or greed.
📊 Macro data hints at cautious optimism but watch for upcoming labor reports.
🐂 Overall bias leans slightly bullish for long-term holders.
📊 Related Pairs to Watch
✨ “If you find value in my analysis, a 👍 and 🚀 boost is much appreciated — it helps me share more setups with the community!”
#NASDAQ100 #US100 #NDX #SPX500 #DJI #TradingView #SwingTrade #ScalpTrading #LayeringStrategy #MarketAnalysis
การซื้อขายยังคงดำเนินอยู่
ปิดการเทรด: ถึงเป้าหมายการทำกำไร
📈 US100 INDEX CFD Live SnapshotQuick Take: Tech-driven US100 holds steady amid balanced macro signals, with a slight pullback from recent peaks. Real data breakdown ahead – crisp, no extras. 🚀
💹 Live Market Pulse
Current Level: 24,992.00
Daily Move: Down 118.00 points (-0.47%)
Explanation: Index reflects Nasdaq 100 futures close from prior session, trading flat to soft in early hours on profit-taking in semis. Average volume points to consolidation, not reversal – ideal for CFD scalps on any intraday bounce. As a trader, pair this with VIX for entry cues; spot price syncs tight for leveraged plays.
🔍 Fundamental & Macro Score Points
These key economic pillars drive US100 direction. Scored simply: 🟢 Strong (growth booster), 🟡 Neutral (even keel), 🔴 Weak (drag). Pulled from fresh releases only.
Interest Rates: Fed Funds at 4.00%-4.25% (post-Sep adjustment). 🟢 Strong. Lower target range cuts corporate debt costs, sparking capex in tech giants – direct lift for index leaders like the Magnificent 7.
Inflation Rates: CPI at 2.9% (Aug YoY). 🟡 Neutral. Mild uptick from July but anchored near Fed's 2% goal, allowing steady policy without shocks. Keeps input prices tame for US100's consumer-facing names.
GDP Rates: 3.8% growth (Q2 final; Q3 estimate steady). 🟢 Strong. Solid expansion fuels tech demand via robust jobs and spending – AI/cloud sectors ride this wave for sustained rallies.
Trader Tip: Easing rates plus GDP muscle scream opportunity, but eye CPI's next print for any hawkish twist. Stack these for multi-timeframe bias.
🌦️ Seasonal Tendencies
October Historical Edge: Average +2.5% gain – second-strongest month for US100 since 1990.
Explanation: Backtested data highlights fall strength from holiday build-up and earnings cycles. Patterns hold in 70%+ of years; use as tailwind confirmation, not standalone trigger. As a trader, overlay with volume for high-conviction longs. 🍂📈
🏦 Bank Orders (Institutional Flow)
Latest CFTC Snapshot: Net long positioning in Nasdaq futures from managed money (as of Sep 23 data).
Explanation: Institutions hold 51.3% long vs. 61.3% short overall, but non-comms tilt bullish with reduced spreads. Signals pro accumulation ahead of Q4 – "smart money" often precedes retail moves.
😊 Trader Sentiment Outlook
Retail Traders: 65% Long / 35% Short (bullish lean from broker flows).
Institutional Traders: 70% Long / 30% Short (firm pro edge).
Explanation: Retail dips in with optimism on tech rebounds; instos amplify via futures. Overall pulse: Mild greed without froth – tracks via options ratios. Pro note: Watch for 80% retail extremes to counter-trade; here, alignment favors upside.
😱 Fear & Greed Index
Current Reading: 54 (Neutral)
Explanation: Even split across volatility, momentum, and breadth metrics – no overheated chase, no flight to safety. Blends VIX dips with steady breadth for balanced read. Neutral leaves doors open; trade the edges.
🐂🐻 Overall Market Outlook Score
Bull (Long) – 7/10 Confidence
Explanation: Seasonal lift and macro greens trump minor dips; rate cuts + GDP keep momentum alive into year-end. Bear watch: Inflation creep or flow reversals, but prints say hold the line. Trader's edge: Real data like this sharpens setups – risk smart! 💪
💰 Money-Making Analysis
• Forex💹
• Indices📈
• Crypto ₿
• Commodities⚡
• Stocks🏦
• Fundamental + Macro📊
• Sentiment🔎
👉 Ask what analysis you need & get it FREE!
Join Discord for signals + data & grab the Master Plan: discord.gg/ZQS3y7FhVr
• Forex💹
• Indices📈
• Crypto ₿
• Commodities⚡
• Stocks🏦
• Fundamental + Macro📊
• Sentiment🔎
👉 Ask what analysis you need & get it FREE!
Join Discord for signals + data & grab the Master Plan: discord.gg/ZQS3y7FhVr
การนำเสนอที่เกี่ยวข้อง
คำจำกัดสิทธิ์ความรับผิดชอบ
ข้อมูลและบทความไม่ได้มีวัตถุประสงค์เพื่อก่อให้เกิดกิจกรรมทางการเงิน, การลงทุน, การซื้อขาย, ข้อเสนอแนะ หรือคำแนะนำประเภทอื่น ๆ ที่ให้หรือรับรองโดย TradingView อ่านเพิ่มเติมใน ข้อกำหนดการใช้งาน