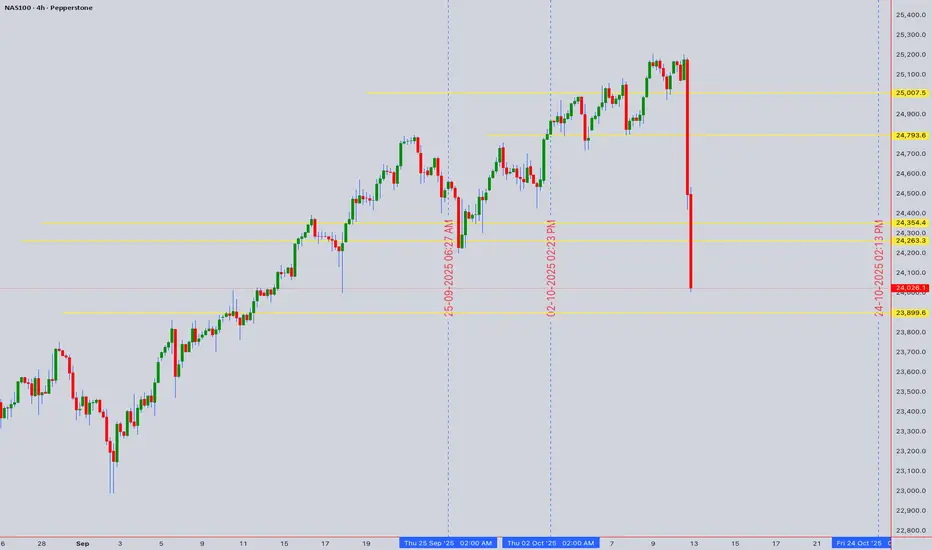
NAS100 Decision Point at All-Time Highs
Asset: NAS100 (NASDAQ 100) 11th Oct 2025 UTC+4
Closing Price: 24,026.1 | Bias: Neutral, awaiting breakout confirmation.
1. Multi-Timeframe Market Structure
Daily Chart Context: The index is in a powerful, sustained uptrend, trading near all-time highs. The recent consolidation suggests a pause within the broader bullish structure.
Critical Resistance: 24,200 - 24,300. A confluence of the recent swing high and a psychological barrier. A decisive daily close above 24,300 is the key bullish trigger.
Key Support Levels:
Immediate: 23,900 (Recent swing low & 4H consolidation base).
Primary: 23,650 - 23,750 (Previous resistance, now key support & 50 EMA area).
Major: 23,400 (Would signal a deeper correction).
2. Chart Pattern & Wyckoff/Elliott Wave Context
Pattern: The price action from the September low exhibits characteristics of a Wyckoff Accumulation phase, followed by a strong markup. The current pause could be a re-accumulation before the next leg up, or a distribution.
Elliott Wave Count: The rally from the ~23,400 low is impulsive. We are likely in a Wave 4 (corrective) consolidation. A break above 24,200 would confirm the start of Wave 5 towards new highs. A break below 23,650 would invalidate this count.
3. Indicator Confluence & Momentum
Ichimoku Cloud (Daily): Price is well above the Senkou Span (Cloud), confirming the strong bullish trend. The cloud itself is thick and rising, providing strong dynamic support.
RSI (14): On the daily, RSI is neutral (~60), not yet overbought, leaving room for further upside.
Bollinger Bands (4H): Price is hugging the upper band, indicating strength. A move to the middle band (~23,950) would be a healthy pullback.
Moving Averages: The 50 EMA (23,850) and 200 EMA (23,500) are bullishly aligned, acting as dynamic support layers.
Actionable Trading Plan
Intraday Trading (Based on 1H/15M Charts)
Bullish Breakout Setup:
Trigger: Sustained price action above 24,150 with rising volume.
Buy Entry: On a pullback to 24,100-24,130, or a break of 24,200.
Stop Loss: Below 24,000.
Targets: 24,300 (TP1), 24,450 (TP2).
Bearish Rejection Setup:
Trigger: Bearish reversal candle (e.g., Shooting Star, Bearish Engulfing) at 24,150-24,200.
Sell Entry: On the confirmation of the rejection.
Stop Loss: Above 24,250.
Targets: 23,950 (TP1), 23,850 (TP2).
Swing Trading (Based on 4H/Daily Charts)
Long Swing Entry:
Condition: Wait for a daily close above 24,300.
Entry: On the next pullback towards 24,200 (new support).
Stop Loss: Below 23,900.
Target: 24,600 - 24,800.
Short Swing Entry (Counter-Trend):
Condition: A clear break and close below 23,900.
Entry: On a retest of 23,900 as resistance.
Stop Loss: Above 24,100.
Target: 23,750, then 23,650.
Risk & Trade Management Note
The current setup is a high-probability bull trap if price fails at the 24,200 resistance. Conversely, a breakout opens significant upside. Do not chase price in the middle of the range. Patience for a confirmed trigger is key. Always use a stop-loss and manage position size accordingly.
I am nothing @shunya.trade
คำจำกัดสิทธิ์ความรับผิดชอบ
ข้อมูลและบทความไม่ได้มีวัตถุประสงค์เพื่อก่อให้เกิดกิจกรรมทางการเงิน, การลงทุน, การซื้อขาย, ข้อเสนอแนะ หรือคำแนะนำประเภทอื่น ๆ ที่ให้หรือรับรองโดย TradingView อ่านเพิ่มเติมใน ข้อกำหนดการใช้งาน
I am nothing @shunya.trade
คำจำกัดสิทธิ์ความรับผิดชอบ
ข้อมูลและบทความไม่ได้มีวัตถุประสงค์เพื่อก่อให้เกิดกิจกรรมทางการเงิน, การลงทุน, การซื้อขาย, ข้อเสนอแนะ หรือคำแนะนำประเภทอื่น ๆ ที่ให้หรือรับรองโดย TradingView อ่านเพิ่มเติมใน ข้อกำหนดการใช้งาน