TradingView Idea: MSI (Motorola Solutions) – Technical Breakout with Fundamental Context
📈 Trade Setup
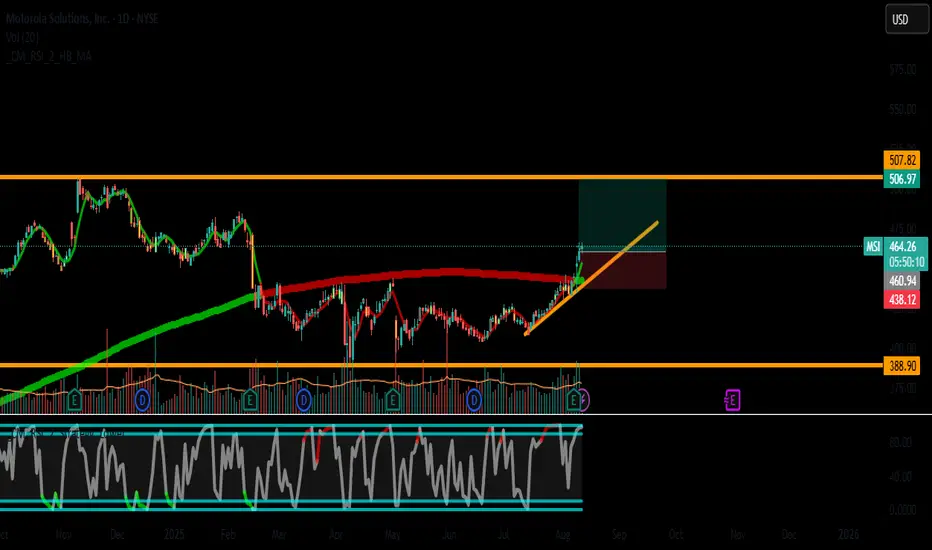
Symbol: MSI (NYSE)
Timeframe: Daily
Entry: $465 (breakout above consolidation)
Stop Loss: $439 (below 50-day SMA)
Take Profit: $507.8 (measured move target)
Risk/Reward: 1:1.6 (5.6% risk | 9.2% reward)
🔍 Technical Analysis
Price Action:
Consolidating between $450-$465 for 2 weeks (bullish pennant).
Breakout above $465 with volume >1.5M shares confirms momentum.
Indicators:
RSI(14): 74 (overbought but holding strong in uptrend).
MACD: Bullish crossover above signal line.
Moving Averages: SMA 20 > SMA 50 > SMA 200 (golden cross).
Trend:
Higher highs/lows since Q2 2025.
No recent RSI2 Connors signals, but price respects bullish structure.
📊 Fundamental Analysis
Valuation:
P/E: 37.1 (sector avg: ~25) → Overvalued.
P/S: 6.9 (sector avg: ~3.5) → Premium pricing.
Debt: Moderate (Debt/Equity: 3.3 | Interest Coverage: 8.1).
Growth: Weak revenue growth (+3.5% YoY) but strong margins.
Dividend: 1.2% yield (low for sector).
Key Risk: High valuation limits upside if earnings disappoint.
⚡ Trade Execution
Entry: Wait for close above $465 with elevated volume.
Position Size: Risk ≤1-2% of capital.
Profit Taking:
50% at $490 (prior resistance).
50% at $507.8 (target).
Stop Management: Trail to breakeven at $475.
🎯 Why This Trade Works
Technical Strength: Breakout with volume support.
Sector Tailwinds: Demand for public safety tech (5G/AI adoption).
Institutional Support: 90% institutional ownership (low float volatility).
⚠️ Risks:
Overbought RSI → Potential pullback.
Next earnings date: Aug 25 (avoid holding through event).
📌 Chart Notes
Key Levels:
Support: $439 (SMA 50) → Critical for invalidation.
Resistance: $490 → First profit zone.
Indicators to Watch: MACD histogram for momentum shifts.
#MSI #BreakoutTrade #TechStocks
Like if you’d take this trade! Comments welcome below.
📌 Disclaimer:
This is not financial advice. Trading carries risks. Past performance ≠ future results. Conduct your own analysis before investing. Motorola Solutions is overvalued fundamentally—this trade is purely technical. Manage risk accordingly.
Discussion:
Would you prioritize technicals over fundamentals here?
How do you trade overbought RSI in strong trends?
📈 Trade Setup
Symbol: MSI (NYSE)
Timeframe: Daily
Entry: $465 (breakout above consolidation)
Stop Loss: $439 (below 50-day SMA)
Take Profit: $507.8 (measured move target)
Risk/Reward: 1:1.6 (5.6% risk | 9.2% reward)
🔍 Technical Analysis
Price Action:
Consolidating between $450-$465 for 2 weeks (bullish pennant).
Breakout above $465 with volume >1.5M shares confirms momentum.
Indicators:
RSI(14): 74 (overbought but holding strong in uptrend).
MACD: Bullish crossover above signal line.
Moving Averages: SMA 20 > SMA 50 > SMA 200 (golden cross).
Trend:
Higher highs/lows since Q2 2025.
No recent RSI2 Connors signals, but price respects bullish structure.
📊 Fundamental Analysis
Valuation:
P/E: 37.1 (sector avg: ~25) → Overvalued.
P/S: 6.9 (sector avg: ~3.5) → Premium pricing.
Debt: Moderate (Debt/Equity: 3.3 | Interest Coverage: 8.1).
Growth: Weak revenue growth (+3.5% YoY) but strong margins.
Dividend: 1.2% yield (low for sector).
Key Risk: High valuation limits upside if earnings disappoint.
⚡ Trade Execution
Entry: Wait for close above $465 with elevated volume.
Position Size: Risk ≤1-2% of capital.
Profit Taking:
50% at $490 (prior resistance).
50% at $507.8 (target).
Stop Management: Trail to breakeven at $475.
🎯 Why This Trade Works
Technical Strength: Breakout with volume support.
Sector Tailwinds: Demand for public safety tech (5G/AI adoption).
Institutional Support: 90% institutional ownership (low float volatility).
⚠️ Risks:
Overbought RSI → Potential pullback.
Next earnings date: Aug 25 (avoid holding through event).
📌 Chart Notes
Key Levels:
Support: $439 (SMA 50) → Critical for invalidation.
Resistance: $490 → First profit zone.
Indicators to Watch: MACD histogram for momentum shifts.
#MSI #BreakoutTrade #TechStocks
Like if you’d take this trade! Comments welcome below.
📌 Disclaimer:
This is not financial advice. Trading carries risks. Past performance ≠ future results. Conduct your own analysis before investing. Motorola Solutions is overvalued fundamentally—this trade is purely technical. Manage risk accordingly.
Discussion:
Would you prioritize technicals over fundamentals here?
How do you trade overbought RSI in strong trends?
คำจำกัดสิทธิ์ความรับผิดชอบ
ข้อมูลและบทความไม่ได้มีวัตถุประสงค์เพื่อก่อให้เกิดกิจกรรมทางการเงิน, การลงทุน, การซื้อขาย, ข้อเสนอแนะ หรือคำแนะนำประเภทอื่น ๆ ที่ให้หรือรับรองโดย TradingView อ่านเพิ่มเติมใน ข้อกำหนดการใช้งาน
คำจำกัดสิทธิ์ความรับผิดชอบ
ข้อมูลและบทความไม่ได้มีวัตถุประสงค์เพื่อก่อให้เกิดกิจกรรมทางการเงิน, การลงทุน, การซื้อขาย, ข้อเสนอแนะ หรือคำแนะนำประเภทอื่น ๆ ที่ให้หรือรับรองโดย TradingView อ่านเพิ่มเติมใน ข้อกำหนดการใช้งาน