hi traders,
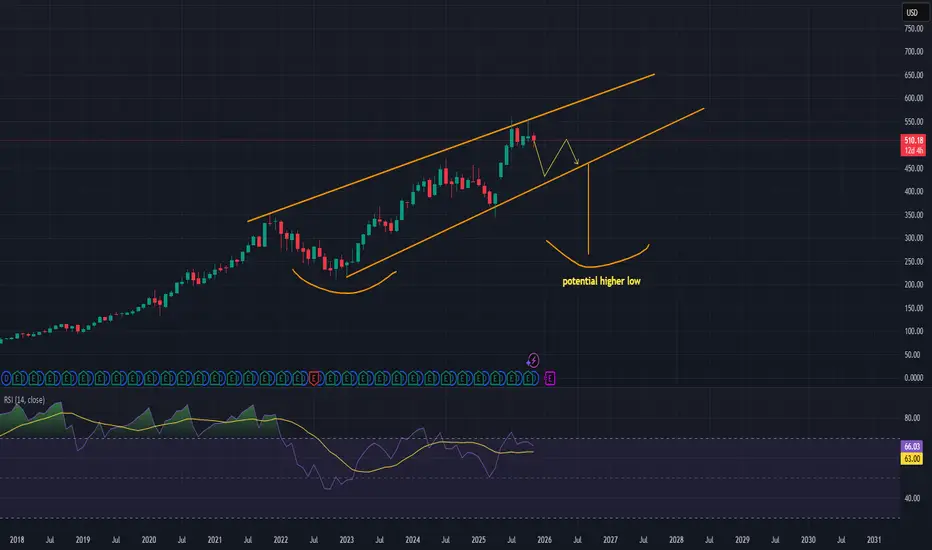
This analysis of the Microsoft ( MSFT) monthly chart identifies a bearish technical pattern that suggests a significant correction is imminent, likely forming a necessary higher low before the continuation of the macro bull market.
Key Technical Observations
Rising Wedge Pattern: The price action over the last several years has formed a clear Rising Wedge pattern (marked by the two converging orange trendlines). This pattern is defined by a series of higher highs and higher lows, with the momentum decreasing as the price moves up and the trendlines narrow.
Interpretation: The Rising Wedge is a bearish reversal pattern. It typically resolves with a sharp break below the lower trendline. The recent move upward suggests the price is currently retesting the upper boundary of the wedge.
Momentum Check (RSI): The Relative Strength Index (RSI) is currently trending in the bullish zone (above 50.00), but it has recently turned down after failing to make strong new highs, indicating a loss of upward momentum. The current reading is 66.83, which still suggests some overbought condition relative to the previous range.
Projected Correction Path: The chart suggests the price will face resistance near the top of the wedge, leading to a breakdown below the current price level. The projected path (yellow arrows) targets a drop towards the lower trendline of the wedge.
Strategic Outlook: Forming the Macro Higher Low
The most important feature of this setup is the concept of the potential higher low (labeled on the chart).
Necessity of Correction: For any healthy, long-term bull market to continue, corrections are needed to reset indicators and shake out weaker hands.
The Higher Low: The projected support at the lower trendline is expected to form a Higher Low relative to the previous major swing low (the curved yellow line at the bottom of the wedge, seen around 2023).
Trade Idea: A break below the current level and a move towards the lower trendline would establish this higher low, completing the bearish phase of the pattern and providing a prime long-term accumulation zone for the next leg of the macro bull market.
Conclusion:
While the short-to-medium term outlook is bearish, targeting a move down to the lower boundary of the Rising Wedge, this correction is viewed as a necessary and healthy event. The key level to watch is the lower trendline, as its defense will confirm the creation of a macro higher low and signal the continuation of Microsoft's secular bull trend.
This analysis of the Microsoft (
Key Technical Observations
Rising Wedge Pattern: The price action over the last several years has formed a clear Rising Wedge pattern (marked by the two converging orange trendlines). This pattern is defined by a series of higher highs and higher lows, with the momentum decreasing as the price moves up and the trendlines narrow.
Interpretation: The Rising Wedge is a bearish reversal pattern. It typically resolves with a sharp break below the lower trendline. The recent move upward suggests the price is currently retesting the upper boundary of the wedge.
Momentum Check (RSI): The Relative Strength Index (RSI) is currently trending in the bullish zone (above 50.00), but it has recently turned down after failing to make strong new highs, indicating a loss of upward momentum. The current reading is 66.83, which still suggests some overbought condition relative to the previous range.
Projected Correction Path: The chart suggests the price will face resistance near the top of the wedge, leading to a breakdown below the current price level. The projected path (yellow arrows) targets a drop towards the lower trendline of the wedge.
Strategic Outlook: Forming the Macro Higher Low
The most important feature of this setup is the concept of the potential higher low (labeled on the chart).
Necessity of Correction: For any healthy, long-term bull market to continue, corrections are needed to reset indicators and shake out weaker hands.
The Higher Low: The projected support at the lower trendline is expected to form a Higher Low relative to the previous major swing low (the curved yellow line at the bottom of the wedge, seen around 2023).
Trade Idea: A break below the current level and a move towards the lower trendline would establish this higher low, completing the bearish phase of the pattern and providing a prime long-term accumulation zone for the next leg of the macro bull market.
Conclusion:
While the short-to-medium term outlook is bearish, targeting a move down to the lower boundary of the Rising Wedge, this correction is viewed as a necessary and healthy event. The key level to watch is the lower trendline, as its defense will confirm the creation of a macro higher low and signal the continuation of Microsoft's secular bull trend.
💥 Free signals and ideas ➡ t.me/vfinvestment
คำจำกัดสิทธิ์ความรับผิดชอบ
ข้อมูลและบทความไม่ได้มีวัตถุประสงค์เพื่อก่อให้เกิดกิจกรรมทางการเงิน, การลงทุน, การซื้อขาย, ข้อเสนอแนะ หรือคำแนะนำประเภทอื่น ๆ ที่ให้หรือรับรองโดย TradingView อ่านเพิ่มเติมใน ข้อกำหนดการใช้งาน
💥 Free signals and ideas ➡ t.me/vfinvestment
คำจำกัดสิทธิ์ความรับผิดชอบ
ข้อมูลและบทความไม่ได้มีวัตถุประสงค์เพื่อก่อให้เกิดกิจกรรมทางการเงิน, การลงทุน, การซื้อขาย, ข้อเสนอแนะ หรือคำแนะนำประเภทอื่น ๆ ที่ให้หรือรับรองโดย TradingView อ่านเพิ่มเติมใน ข้อกำหนดการใช้งาน
