Hey there!
Date: August 21, 2025
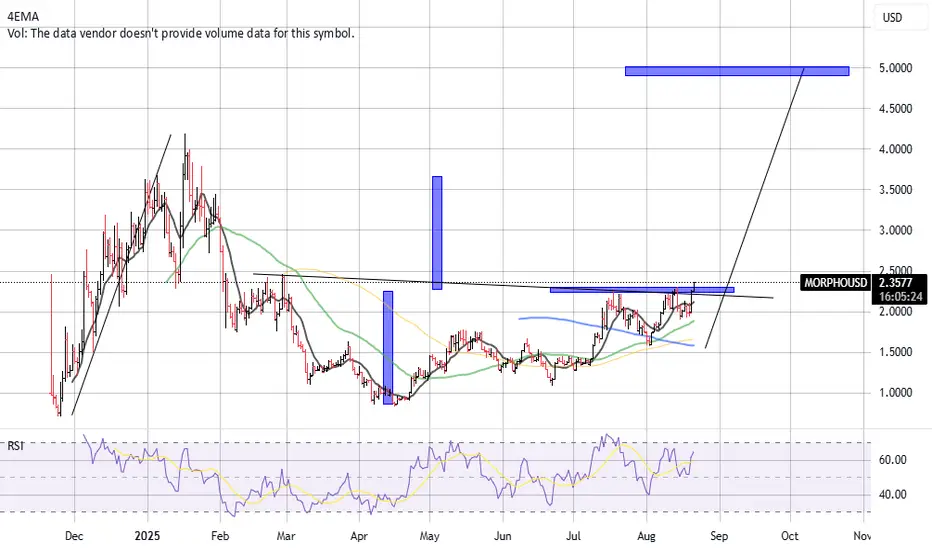
MORPH/USDT is consolidating right below a critical resistance zone and appears to be preparing for a breakout. If confirmed, the upside potential is significant.
🔍 Technical Overview:
Current Price: $2.35
EMA Levels:
4EMA: $2.11
50EMA: $1.87
100EMA: $1.65
200EMA: $1.57
The price is currently trading above all major EMAs, showing strong bullish alignment.
📊 Structure & Price Action:
Price has been consolidating under the $2.35–2.40 resistance zone, repeatedly testing it.
A clean horizontal resistance line is visible; a breakout above this level would unlock higher targets.
The recent higher lows indicate buyers are in control and pushing price upward.
📉 Key Support Levels:
$2.11 (4EMA dynamic support)
$1.87 (50EMA)
$1.65–$1.57 (deep retracement supports near 100/200EMA)
📈 Key Resistance & Target Zones:
Immediate resistance: $2.35–2.40
Breakout target: $5.00 zone (major measured move target marked on chart)
📊 Indicators:
RSI: 64.53 – In bullish territory but not overbought, leaving room for continuation.
No volume data available on this chart, but the structure itself suggests accumulation near resistance.
🎯 Bullish Outlook:
Trend: Bullish structure with higher lows and EMA alignment
Breakout above $2.40 could trigger a sharp move toward $5.00
Pullbacks to $2.10–$2.00 may offer good re-entry opportunities for continuation traders
📉 Invalidation:
A rejection and breakdown below $1.87 would weaken the structure
Loss of the $1.65–1.57 zone would invalidate the bullish breakout setup
Good Trading :-)
Date: August 21, 2025
MORPH/USDT is consolidating right below a critical resistance zone and appears to be preparing for a breakout. If confirmed, the upside potential is significant.
🔍 Technical Overview:
Current Price: $2.35
EMA Levels:
4EMA: $2.11
50EMA: $1.87
100EMA: $1.65
200EMA: $1.57
The price is currently trading above all major EMAs, showing strong bullish alignment.
📊 Structure & Price Action:
Price has been consolidating under the $2.35–2.40 resistance zone, repeatedly testing it.
A clean horizontal resistance line is visible; a breakout above this level would unlock higher targets.
The recent higher lows indicate buyers are in control and pushing price upward.
📉 Key Support Levels:
$2.11 (4EMA dynamic support)
$1.87 (50EMA)
$1.65–$1.57 (deep retracement supports near 100/200EMA)
📈 Key Resistance & Target Zones:
Immediate resistance: $2.35–2.40
Breakout target: $5.00 zone (major measured move target marked on chart)
📊 Indicators:
RSI: 64.53 – In bullish territory but not overbought, leaving room for continuation.
No volume data available on this chart, but the structure itself suggests accumulation near resistance.
🎯 Bullish Outlook:
Trend: Bullish structure with higher lows and EMA alignment
Breakout above $2.40 could trigger a sharp move toward $5.00
Pullbacks to $2.10–$2.00 may offer good re-entry opportunities for continuation traders
📉 Invalidation:
A rejection and breakdown below $1.87 would weaken the structure
Loss of the $1.65–1.57 zone would invalidate the bullish breakout setup
Good Trading :-)
ปิดการเทรด: ถึงเป้าหมายการตัดขาดทุน
big break out, but it returned back , stop hitted , we are re evaluate, even the markets turbulence ;-) Who Dares always Wins!
My contact on Telegram: @Etelve
My contact on Telegram: @Etelve
คำจำกัดสิทธิ์ความรับผิดชอบ
ข้อมูลและบทความไม่ได้มีวัตถุประสงค์เพื่อก่อให้เกิดกิจกรรมทางการเงิน, การลงทุน, การซื้อขาย, ข้อเสนอแนะ หรือคำแนะนำประเภทอื่น ๆ ที่ให้หรือรับรองโดย TradingView อ่านเพิ่มเติมใน ข้อกำหนดการใช้งาน
Who Dares always Wins!
My contact on Telegram: @Etelve
My contact on Telegram: @Etelve
คำจำกัดสิทธิ์ความรับผิดชอบ
ข้อมูลและบทความไม่ได้มีวัตถุประสงค์เพื่อก่อให้เกิดกิจกรรมทางการเงิน, การลงทุน, การซื้อขาย, ข้อเสนอแนะ หรือคำแนะนำประเภทอื่น ๆ ที่ให้หรือรับรองโดย TradingView อ่านเพิ่มเติมใน ข้อกำหนดการใช้งาน