Hey Guys!
Date: September 29, 2025
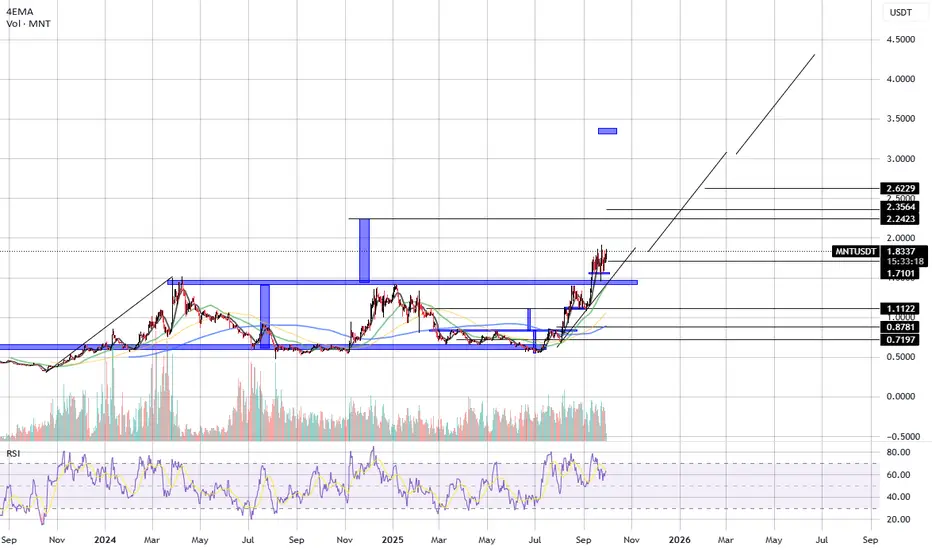
MNT has finally broken above its long-term resistance zone and is showing strong upward momentum. The chart structure suggests that the trend has shifted decisively bullish, with room for significant continuation.
🔍 Technical Snapshot:
Current Price: $1.84
EMA (4): $1.71
👉 Price is comfortably trading above its EMA, showing strong trend support.
📊 Chart Structure & Price Action:
Multi-year accumulation and resistance around $1.10–$1.70 (blue zone) has now been broken.
Price has flipped this range into support, a classic sign of strength.
Strong volume confirms the breakout is backed by real demand.
📉 Supports to Watch:
$1.71 (immediate support, trendline area)
$1.11 (major retest level from the breakout base)
$0.87 – $0.72 (deeper historical demand zones)
📈 Upside Targets:
First target: $2.24
Next levels: $2.35 → $2.50 → $2.62
Extension target: $3.50+ if momentum accelerates
📊 Momentum & Indicators:
RSI: currently above 60, showing strong but not yet overextended momentum.
Volume profile supports further continuation, with little overhead resistance until the $2.20+ zone.
🎯 Creative Bullish Outlook:
MNT looks like it’s entering a new growth phase after years of compression and failed breakout attempts. This clean breakout from the $1.10–$1.70 barrier could open the road toward the $2.20–$2.60 range in the short to medium term. If buyers keep control, the bigger target sits near $3.50–$4.00.
📉 Invalidation:
A daily close back under $1.71 would weaken short-term momentum.
Losing $1.11 would flip the structure bearish again, returning price into the old range.
⚡ Summary:
MNT is in a confirmed breakout from a multi-year resistance structure. As long as price holds above $1.71, the bullish trend remains intact with targets at $2.24 → $2.50 → $2.62 → $3.50+.
good trading!
Date: September 29, 2025
MNT has finally broken above its long-term resistance zone and is showing strong upward momentum. The chart structure suggests that the trend has shifted decisively bullish, with room for significant continuation.
🔍 Technical Snapshot:
Current Price: $1.84
EMA (4): $1.71
👉 Price is comfortably trading above its EMA, showing strong trend support.
📊 Chart Structure & Price Action:
Multi-year accumulation and resistance around $1.10–$1.70 (blue zone) has now been broken.
Price has flipped this range into support, a classic sign of strength.
Strong volume confirms the breakout is backed by real demand.
📉 Supports to Watch:
$1.71 (immediate support, trendline area)
$1.11 (major retest level from the breakout base)
$0.87 – $0.72 (deeper historical demand zones)
📈 Upside Targets:
First target: $2.24
Next levels: $2.35 → $2.50 → $2.62
Extension target: $3.50+ if momentum accelerates
📊 Momentum & Indicators:
RSI: currently above 60, showing strong but not yet overextended momentum.
Volume profile supports further continuation, with little overhead resistance until the $2.20+ zone.
🎯 Creative Bullish Outlook:
MNT looks like it’s entering a new growth phase after years of compression and failed breakout attempts. This clean breakout from the $1.10–$1.70 barrier could open the road toward the $2.20–$2.60 range in the short to medium term. If buyers keep control, the bigger target sits near $3.50–$4.00.
📉 Invalidation:
A daily close back under $1.71 would weaken short-term momentum.
Losing $1.11 would flip the structure bearish again, returning price into the old range.
⚡ Summary:
MNT is in a confirmed breakout from a multi-year resistance structure. As long as price holds above $1.71, the bullish trend remains intact with targets at $2.24 → $2.50 → $2.62 → $3.50+.
good trading!
คำจำกัดสิทธิ์ความรับผิดชอบ
ข้อมูลและบทความไม่ได้มีวัตถุประสงค์เพื่อก่อให้เกิดกิจกรรมทางการเงิน, การลงทุน, การซื้อขาย, ข้อเสนอแนะ หรือคำแนะนำประเภทอื่น ๆ ที่ให้หรือรับรองโดย TradingView อ่านเพิ่มเติมที่ ข้อกำหนดการใช้งาน
คำจำกัดสิทธิ์ความรับผิดชอบ
ข้อมูลและบทความไม่ได้มีวัตถุประสงค์เพื่อก่อให้เกิดกิจกรรมทางการเงิน, การลงทุน, การซื้อขาย, ข้อเสนอแนะ หรือคำแนะนำประเภทอื่น ๆ ที่ให้หรือรับรองโดย TradingView อ่านเพิ่มเติมที่ ข้อกำหนดการใช้งาน