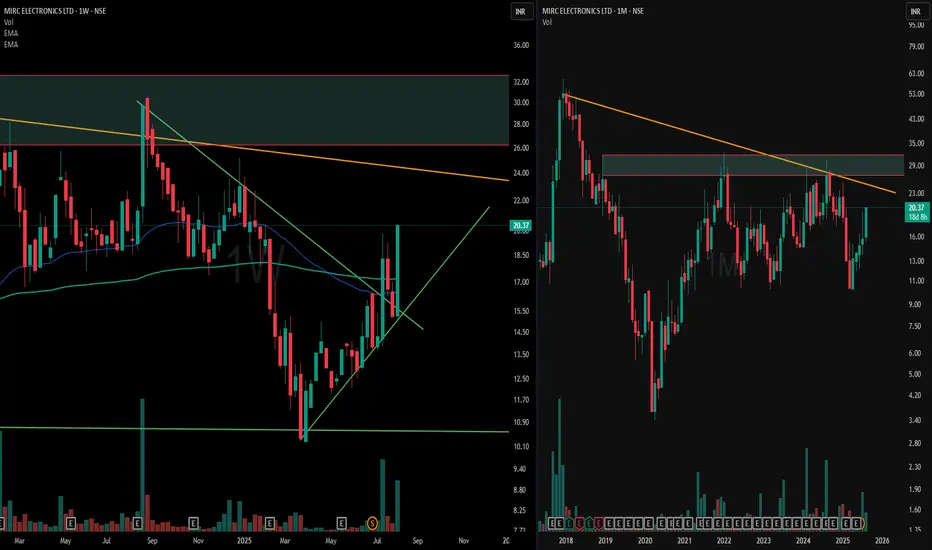
📊 Left Chart – Weekly Timeframe (WTF)
Price shifted from a series of lower highs/lows to forming a W-bottom entirely below the 200 & 50 EMA. Post-recovery, it moved into a channel consolidation, held by a green ascending support and capped by a green counter-trendline, creating a clean geometric structure.
📈 Right Chart – Monthly Timeframe (MTF)
A broader view reveals multi-fold hindrances, with red & orange trendlines marking a multi-year counter-trend. Each upside push faces historical resistance near the supply zone.
📝 Editorial Note:
Not a forecast — simply a snapshot of evolving structure from compressed weekly action to obstacle-heavy monthly context.
🎯 Master My Self-Made Trading Strategy
📈 Telegram (Learn Today): t.me/hashtaghammer
✅ WhatsApp (Learn Today): wa.me/919455664601
📈 Telegram (Learn Today): t.me/hashtaghammer
✅ WhatsApp (Learn Today): wa.me/919455664601
การนำเสนอที่เกี่ยวข้อง
คำจำกัดสิทธิ์ความรับผิดชอบ
ข้อมูลและบทความไม่ได้มีวัตถุประสงค์เพื่อก่อให้เกิดกิจกรรมทางการเงิน, การลงทุน, การซื้อขาย, ข้อเสนอแนะ หรือคำแนะนำประเภทอื่น ๆ ที่ให้หรือรับรองโดย TradingView อ่านเพิ่มเติมใน ข้อกำหนดการใช้งาน