📊 Pattern Analysis
1. Pole Formation:
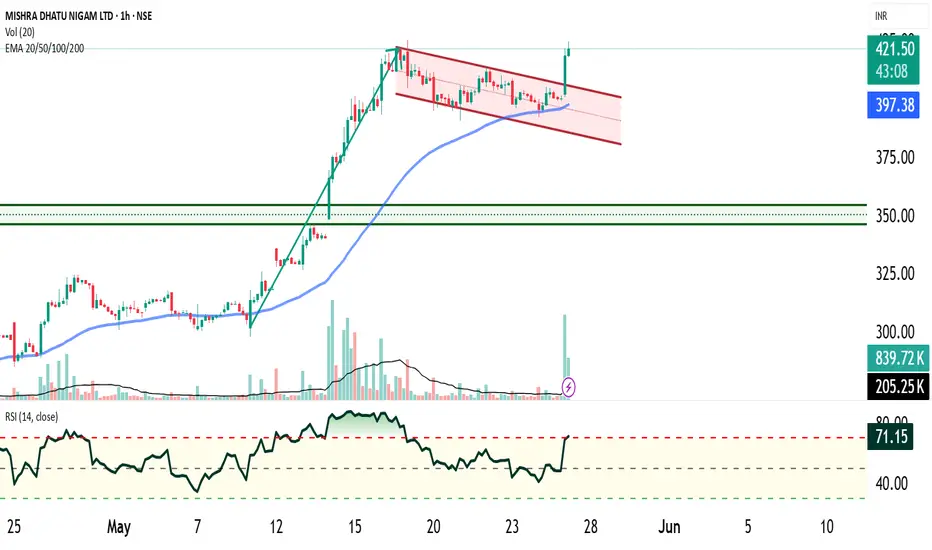
The initial rally forming the flagpole is marked by high-momentum bullish candles rising at approximately a 60° angle, supported by increasing volume, indicating strong institutional buying and trend conviction.
2. Flag Formation:
Following the pole, the stock entered a consolidation phase forming a downward-sloping parallel channel (the flag). This retracement occurred on declining volume, a classic sign of a healthy correction with no aggressive selling pressure — reinforcing the validity of a bullish flag.
3. Breakout Confirmation:
The stock has now broken out above the flag resistance with a large bullish candle and surge in volume, confirming the continuation of the prior uptrend. The breakout candle shows a decisive close above the flag range, indicating strong buyer interest.
📈 Technical Indicators
🎯 Trade Setup
Parameter Level
Entry On breakout confirmation or minor pullback
Target Height of the pole added to breakout point
Stop-Loss Below the recent swing low (bottom of flag) or trailing SL aligned with the 50 EMA
Risk-Reward Favorable – allows strategic trailing of profits
📌 Example Calculation:
If the pole is ₹80 high and the breakout occurred at ₹320, target = ₹400.
📌 Conclusion
MIDHANI has confirmed a textbook bullish flag breakout with strong technicals in place:
🔁 Call to Action
✅ Follow for more updates
👍 Like if you found this analysis helpful
📤 Share with your friends and fellow traders
1. Pole Formation:
The initial rally forming the flagpole is marked by high-momentum bullish candles rising at approximately a 60° angle, supported by increasing volume, indicating strong institutional buying and trend conviction.
2. Flag Formation:
Following the pole, the stock entered a consolidation phase forming a downward-sloping parallel channel (the flag). This retracement occurred on declining volume, a classic sign of a healthy correction with no aggressive selling pressure — reinforcing the validity of a bullish flag.
3. Breakout Confirmation:
The stock has now broken out above the flag resistance with a large bullish candle and surge in volume, confirming the continuation of the prior uptrend. The breakout candle shows a decisive close above the flag range, indicating strong buyer interest.
📈 Technical Indicators
- Volume: Volume has spiked significantly on the breakout day, validating the move.
- 50 EMA: Price has respected the 50-day EMA, which has acted as dynamic support throughout the flag formation.
- RSI: The Relative Strength Index is currently above 65, indicating strong bullish momentum but still below overbought levels, allowing room for further upside.
🎯 Trade Setup
Parameter Level
Entry On breakout confirmation or minor pullback
Target Height of the pole added to breakout point
Stop-Loss Below the recent swing low (bottom of flag) or trailing SL aligned with the 50 EMA
Risk-Reward Favorable – allows strategic trailing of profits
📌 Example Calculation:
If the pole is ₹80 high and the breakout occurred at ₹320, target = ₹400.
📌 Conclusion
MIDHANI has confirmed a textbook bullish flag breakout with strong technicals in place:
- High-angle pole on volume,
- Shallow flag pullback with weak volume,
- Breakout with rising momentum and EMA support.
- This setup suggests a strong trend continuation and offers an attractive opportunity for momentum traders and swing positions.
🔁 Call to Action
✅ Follow for more updates
👍 Like if you found this analysis helpful
📤 Share with your friends and fellow traders
คำจำกัดสิทธิ์ความรับผิดชอบ
ข้อมูลและบทความไม่ได้มีวัตถุประสงค์เพื่อก่อให้เกิดกิจกรรมทางการเงิน, การลงทุน, การซื้อขาย, ข้อเสนอแนะ หรือคำแนะนำประเภทอื่น ๆ ที่ให้หรือรับรองโดย TradingView อ่านเพิ่มเติมที่ ข้อกำหนดการใช้งาน
คำจำกัดสิทธิ์ความรับผิดชอบ
ข้อมูลและบทความไม่ได้มีวัตถุประสงค์เพื่อก่อให้เกิดกิจกรรมทางการเงิน, การลงทุน, การซื้อขาย, ข้อเสนอแนะ หรือคำแนะนำประเภทอื่น ๆ ที่ให้หรือรับรองโดย TradingView อ่านเพิ่มเติมที่ ข้อกำหนดการใช้งาน