📝 Summary
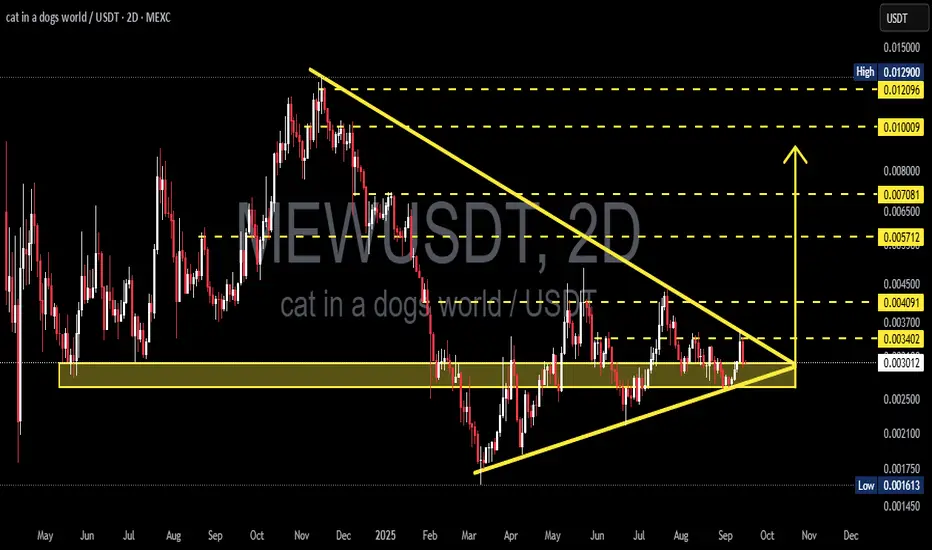
The MEWU/USDT pair is currently consolidating after a strong downtrend since early 2025. Price has been compressing into a symmetrical triangle pattern, trapped between a horizontal support zone at 0.0027–0.0033 and a descending resistance trendline.
The structure is now very close to its apex → meaning a major breakout (up or down) is imminent. The next move will likely set the medium- to long-term direction of this token.
---
🔎 Pattern & Market Structure
Main pattern: Symmetrical Triangle — formed by higher lows and lower highs.
Market context: Appears after a steep downtrend. Symmetrical triangles are technically neutral, but the initial bias leans slightly bearish until proven otherwise.
Accumulation zone: 0.0027–0.0033 has acted as a key battleground between buyers and sellers.
Key levels:
Supports: 0.0027 → 0.0021 → 0.00175 → 0.001613 (major low)
Resistances: 0.003402 → 0.004091 → 0.005712 → 0.007081 → 0.010009 → 0.012096
---
🚀 Bullish Scenario (If Breakout Upward)
1. Confirmation: A 2D close above 0.0034–0.0035 with strong volume.
2. Healthy retest: Price retests 0.0034–0.0030 as new support. If it holds → bullish confirmation.
3. Targets:
🎯 TP1: 0.00409 (+35%)
🎯 TP2: 0.00571 (+89%)
🎯 TP3: 0.00708
🎯 Extended target: 0.0100 – 0.0120 (if momentum/FOMO enters).
4. Risk management: Stop loss below 0.0027; aim for R:R ≥ 1:2.
> An upside breakout would signal a major trend reversal after months of consolidation. The move could be explosive.
---
🐻 Bearish Scenario (If Breakdown Downward)
1. Confirmation: A 2D close below 0.0027 with heavy selling volume.
2. Failed retest: Price retests 0.0027–0.0029 from below and gets rejected → bearish continuation.
3. Targets:
🎯 TP1: 0.0025
🎯 TP2: 0.0021
🎯 TP3: 0.00175
🎯 TP4: 0.00161 (major historical support).
4. Risk management: Stop loss above 0.0034 if shorting.
> A downside break would confirm trend continuation, exposing MEWU to another 30–50% decline.
---
📌 Key Notes
The longer the triangle compresses, the stronger the breakout tends to be.
Volume is the key indicator → no volume = high risk of false breakout.
On the 2D timeframe, any breakout can drive a trend lasting weeks to months.
Expect high volatility due to relatively low liquidity in smaller tokens.
---
📢 Conclusion
MEWU/USDT is at a critical crossroads. The symmetrical triangle formed since March is nearing its apex, and a directional breakout is imminent.
Breakout upward → potential rally of +100% toward 0.0057–0.0070.
Breakdown downward → risk of a 30–50% drop toward 0.0016.
📌 Best approach: wait for confirmation (close + volume + retest) before entering. Patience here can prevent being trapped in a false move.
---
#MEWU #MEWUUSDT #CryptoAnalysis #Breakout #TrianglePattern #Altcoin #TechnicalAnalysis #BullishScenario #BearishScenario
✅ Get Free Signals! Join Our Telegram Channel Here: t.me/TheCryptoNuclear
✅ Twitter: twitter.com/crypto_nuclear
✅ Join Bybit : partner.bybit.com/b/nuclearvip
✅ Benefits : Lifetime Trading Fee Discount -50%
✅ Twitter: twitter.com/crypto_nuclear
✅ Join Bybit : partner.bybit.com/b/nuclearvip
✅ Benefits : Lifetime Trading Fee Discount -50%
คำจำกัดสิทธิ์ความรับผิดชอบ
ข้อมูลและบทความไม่ได้มีวัตถุประสงค์เพื่อก่อให้เกิดกิจกรรมทางการเงิน, การลงทุน, การซื้อขาย, ข้อเสนอแนะ หรือคำแนะนำประเภทอื่น ๆ ที่ให้หรือรับรองโดย TradingView อ่านเพิ่มเติมที่ ข้อกำหนดการใช้งาน