Max Estates Ltd, the real estate arm of the Max Group, is evolving into a full-spectrum developer with a focus on premium residential and commercial assets. The company’s business model now blends development income with stable leasing revenue from Grade-A office spaces.
Key Financial Highlights (TTM):
*Revenue: ₹282.1 crore — strong year-on-year growth led by leasing and new project sales.
*Net Profit: ₹50.7 crore — a significant improvement, showing margin recovery.
*Earnings per Share (EPS): ₹2.02 — profitability is rising but yet to reflect full asset utilization.
*Price to Earnings (P/E): ~148.7× — reflects rich valuation and high market expectations.
*Price to Book (P/B): 3.37× — market values assets significantly above book.
*Debt to Equity: 0.73× — moderate leverage; comfortable debt profile for a real-estate company.
*Return on Equity (ROE): 1.8 % — still low; operational efficiency needs improvement.
*EV/EBITDA: 63.5× — expensive relative to peers, suggesting optimism on growth execution.
*Current Ratio: 2.0× — good short-term liquidity.
*Interest Coverage: 1.02× — narrow margin; any rise in borrowing cost can pressure profits.
Strengths
*Diversified portfolio across office, retail, and residential projects.
*Expansion through acquisitions such as Base Buildwell and the Delhi One project.
*Strategic partnerships with institutional investors like New York Life.
*Increasing share of recurring leasing income adds stability.
Risks & Concerns
Valuation is stretched; earnings must catch up to justify current price levels.
Thin interest coverage ratio — financial costs must be monitored closely.
Profitability partly supported by “other income,” not just core operations.
Technical Outlook
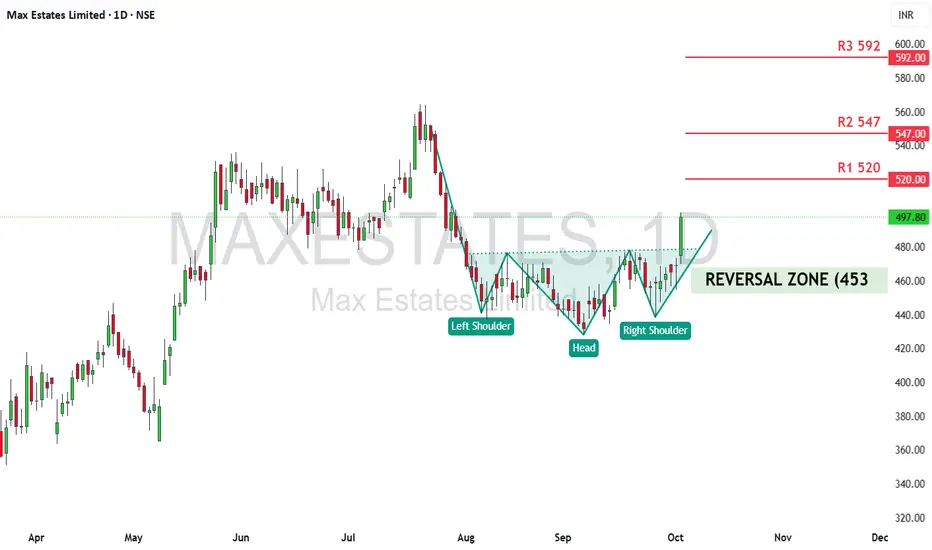
- Pattern: Inverse Head & Shoulders
- Timeframe: Daily (1D)
- Current Price: ₹491.95
- Reversal Zone: ₹453 – ₹468
- Resistance Levels: ₹520, ₹547, ₹592
Analysis:
The chart displays a clear Inverse Head & Shoulders pattern that has just broken above the neckline with strong momentum. This breakout indicates a potential trend reversal from the previous downtrend. Volume expansion confirms buying participation near the breakout zone.
If the stock retests the ₹453–₹468 range and holds, it can act as a strong base for a medium-term move. A sustained close above ₹520 will likely extend the rally toward ₹547 and ₹592 levels.
Conclusion
When strong fundamentals meet a classic reversal pattern, momentum follows conviction.
Max Estates is showing a promising combination of fundamental expansion and technical breakout strength. Sustaining above ₹520 can validate the breakout pattern and pave the way toward ₹590+. A retest near ₹460 would offer a low-risk accumulation opportunity for swing or positional traders.
Disclaimer:tinyurl.com/59ypbsrh
คำจำกัดสิทธิ์ความรับผิดชอบ
ข้อมูลและบทความไม่ได้มีวัตถุประสงค์เพื่อก่อให้เกิดกิจกรรมทางการเงิน, การลงทุน, การซื้อขาย, ข้อเสนอแนะ หรือคำแนะนำประเภทอื่น ๆ ที่ให้หรือรับรองโดย TradingView อ่านเพิ่มเติมที่ ข้อกำหนดการใช้งาน
คำจำกัดสิทธิ์ความรับผิดชอบ
ข้อมูลและบทความไม่ได้มีวัตถุประสงค์เพื่อก่อให้เกิดกิจกรรมทางการเงิน, การลงทุน, การซื้อขาย, ข้อเสนอแนะ หรือคำแนะนำประเภทอื่น ๆ ที่ให้หรือรับรองโดย TradingView อ่านเพิ่มเติมที่ ข้อกำหนดการใช้งาน
