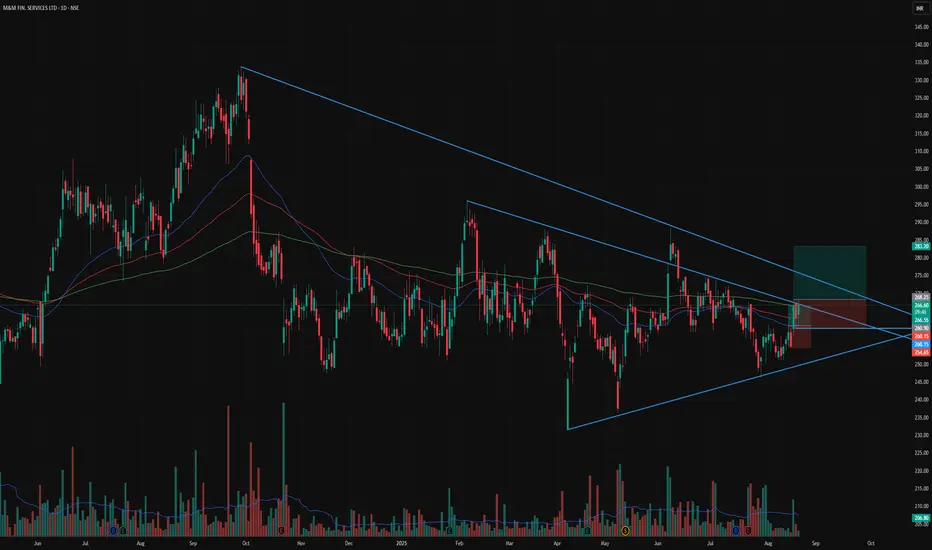
📊 Stock: M&M Financial Services (M&MFIN)
🔹 Symmetrical triangle pattern forming – price squeezing into apex
🔹 Strong bounce from lower trendline with rising volume
🔹 Trading above 50 DMA & 100 DMA – short-term trend improving
🔹 200 DMA resistance near ₹268–270 being tested
🔹 RSI showing strength
🔹 Good support zone at ₹250–255
🔹 Strong financial backing as part of M&M Group
⚡ Price nearing breakout zone (₹268–270)
🚀 Breakout above 268 can trigger a rally towards ₹283–300
⚠️ Support at ₹250 – below this trend may weaken
คำจำกัดสิทธิ์ความรับผิดชอบ
ข้อมูลและบทความไม่ได้มีวัตถุประสงค์เพื่อก่อให้เกิดกิจกรรมทางการเงิน, การลงทุน, การซื้อขาย, ข้อเสนอแนะ หรือคำแนะนำประเภทอื่น ๆ ที่ให้หรือรับรองโดย TradingView อ่านเพิ่มเติมใน ข้อกำหนดการใช้งาน
คำจำกัดสิทธิ์ความรับผิดชอบ
ข้อมูลและบทความไม่ได้มีวัตถุประสงค์เพื่อก่อให้เกิดกิจกรรมทางการเงิน, การลงทุน, การซื้อขาย, ข้อเสนอแนะ หรือคำแนะนำประเภทอื่น ๆ ที่ให้หรือรับรองโดย TradingView อ่านเพิ่มเติมใน ข้อกำหนดการใช้งาน