________________________________________
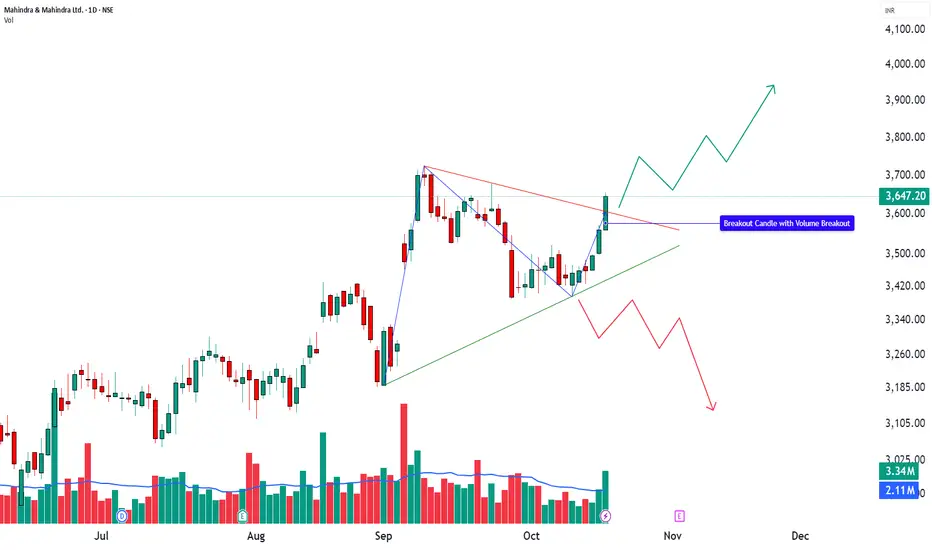
🚙 MAHINDRA & MAHINDRA LTD (NSE: M&M) | CMP ₹3,647.20 (+2.43%)
Sector: Auto | Date: 19 Oct 2025
________________________________________
🔹 Price Action:
M&M posted a strong bullish candle, closing near day’s high at ₹3,647.20 with gains of +2.43%.
Volume surged to 3.34M shares, nearly 2.2× the 20-day average volume (2.10M) — a clear sign of institutional and HNI participation.
The stock confirmed a bullish breakout above ₹3,656, marking a shift from a phase of consolidation to one of expansion.
________________________________________
🔹 Technical Analysis:
Momentum indicators are clearly aligned in favour of the bulls, confirming strength across multiple parameters. RSI (65.55) has broken above its midline, signalling momentum expansion, while MACD (9) shows a positive crossover that reinforces directional conviction. CCI (129.03) reflects sustained trend acceleration, and though Stochastic (96.65) remains in overbought territory, it supports ongoing breakout momentum. The VWAP at ₹3,629.84 acts as an immediate dynamic support, maintaining short-term control with buyers. Additionally, a Bollinger Band breakout accompanied by a BBSqueeze-Off indicates expanding volatility — often a precursor to a strong continuation phase when combined with rising volume and structural breakout confirmation.
________________________________________
🔹 Chart Analysis:
M&M broke out from a symmetrical triangle structure, ending a multi-week consolidation phase.
The breakout candle formed with a wide body and heavy volume, closing near the high — a typical sign of breakout conviction.
Price structure shows higher lows and rising volume, confirming trend continuation rather than exhaustion.
________________________________________
🔹 Key Levels:
Resistance: 3,682 / 3,717 / 3,778
Support: 3,586 / 3,525 / 3,490
VWAP: 3,629.84
A short-term pullback toward VWAP or ₹3,586 could act as a healthy retest before continuation.
Holding above ₹3,525 will keep the structure intact, maintaining bullish control.
________________________________________
🔹 STWP Trade Analysis:
Bias: Bullish
Breakout Level: ₹3,656
Intraday Support: ₹3,619
Swing Support: ₹3,456
Intermediate Support: ₹3,421
Momentum: Strong
Trend: Bullish
Risk: Low
Volume: High
📌 Observation: The breakout candle supported by rising volume and MACD confirmation signals a trend continuation setup with clearly defined risk zones.
________________________________________
🔹 HNI Trade Setup:
Fresh HNI accumulation seen around ₹3,647–₹3,656, supported at ₹3,501, and additional buying interest visible near ₹3,639 with support at ₹3,475.
This structure indicates layered accumulation, suggesting that larger players are positioning within the consolidation rather than chasing price above resistance.
________________________________________
🔹 Final Outlook:
Momentum: Strong | Trend: Bullish | Risk: Low | Volume: High
M&M’s structure indicates a breakout-driven continuation phase backed by volume and indicator alignment.
As long as price holds above ₹3,525, the trend bias remains bullish, with scope for upside toward ₹3,717–₹3,778 in the near term.
A dip toward VWAP or EMA supports would represent healthy price normalization, not weakness.
________________________________________
🔹 Learning Note (Educational Purpose):
This setup showcases how volume + structure + indicator confluence confirms a genuine breakout.
It also demonstrates how smart money accumulates during compression, not after expansion — a crucial lesson for breakout traders.
M&M provides a textbook example of how post-consolidation breakouts evolve into expansion phases.
________________________________________
🔹 STWP Mentor Note:
“Momentum isn’t about chasing; it’s about recognizing conviction early.
M&M’s breakout is a fine example of structure, participation, and patience working in perfect rhythm — where price doesn’t just move, it evolves with purpose.”
________________________________________
───────────────────────────────────────────────
⚠️ **DISCLOSURE & DISCLAIMER (SEBI-Compliant)**
───────────────────────────────────────────────
📘 **Purpose:**
This content is created **solely for educational and informational purposes** to help readers understand market structure, price action, and technical analysis.
It does **not constitute investment advice**, research recommendation, or a solicitation to buy or sell any security.
👤 **Author Disclosure:**
The author is **not a SEBI-registered investment adviser or research analyst.**
All chart studies, price levels, and observations are based on publicly available data (e.g., **NSE India**, **TradingView**) and are presented purely for **learning illustration**.
📊 **Position Status:**
No active position in *[M&M]* at the time of publication.
“The author may sometimes trade in the securities discussed, but such trades are independent and shared here only for educational understanding.”
⚠️ **Risk Disclosure:**
Trading and investing involve financial risk. Market movements can be unpredictable, and losses may exceed invested capital.
Readers are strongly advised to consult a **SEBI-registered investment adviser** before making any trading or investment decisions.
🧠 **Responsibility Clause:**
By engaging with this post, you acknowledge that you are **solely responsible for your own trading or investment decisions**, and that this content is intended only for **market education and awareness**.
───────────────────────────────────────────────
💬 **Did You Find This Useful?**
If this analysis helped you understand price structure or market psychology better:
🔼 **Boost** to support transparent & structured financial education.
✍️ **Comment** your insights, observations, or questions — let’s learn together.
🔁 **Share** this post with learners and aspiring traders who value discipline.
📚 **Follow stwp** for more structured, educational breakdowns on stocks & setups.
🚀 *Stay Calm. Stay Clean. Trade With Patience.*
💡 *Trade Smart | Learn Zones | Be Self-Reliant.*
───────────────────────────────────────────────
STWP | Mentor & Demand-Supply Specialist | Empowering traders through structured learning |
simpletradewithpatience.com
Community: chat.whatsapp.com/BEYz0tkqP0fJPBCWf59uel
wa.me/message/6IOPHGOXMGZ4N1
Educational Only
simpletradewithpatience.com
Community: chat.whatsapp.com/BEYz0tkqP0fJPBCWf59uel
wa.me/message/6IOPHGOXMGZ4N1
Educational Only
คำจำกัดสิทธิ์ความรับผิดชอบ
ข้อมูลและบทความไม่ได้มีวัตถุประสงค์เพื่อก่อให้เกิดกิจกรรมทางการเงิน, การลงทุน, การซื้อขาย, ข้อเสนอแนะ หรือคำแนะนำประเภทอื่น ๆ ที่ให้หรือรับรองโดย TradingView อ่านเพิ่มเติมใน ข้อกำหนดการใช้งาน