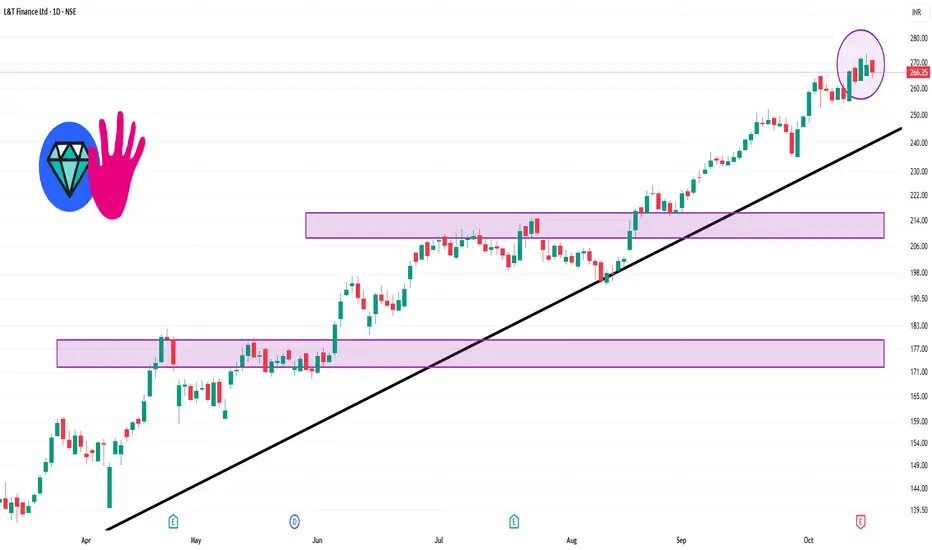
📊 Intraday Support and Resistance Levels
Immediate Support: ₹263.19
First Resistance: ₹270.14
Second Resistance: ₹274.02
Third Resistance: ₹277.09
These levels are derived from pivot point calculations and are commonly used by traders to identify potential entry and exit points.
📈 Technical Indicators
Relative Strength Index (RSI): 63.91, indicating that the stock is approaching overbought territory.
Money Flow Index (MFI): 78.20, suggesting strong buying interest.
MACD: The MACD line is at 9.28, with the signal line at 9.06, showing a bullish crossover.
Average True Range (ATR): ₹7.16, reflecting moderate volatility.
Average Directional Index (ADX): 38.39, indicating a strong trend.
การนำเสนอที่เกี่ยวข้อง
คำจำกัดสิทธิ์ความรับผิดชอบ
ข้อมูลและบทความไม่ได้มีวัตถุประสงค์เพื่อก่อให้เกิดกิจกรรมทางการเงิน, การลงทุน, การซื้อขาย, ข้อเสนอแนะ หรือคำแนะนำประเภทอื่น ๆ ที่ให้หรือรับรองโดย TradingView อ่านเพิ่มเติมใน ข้อกำหนดการใช้งาน
การนำเสนอที่เกี่ยวข้อง
คำจำกัดสิทธิ์ความรับผิดชอบ
ข้อมูลและบทความไม่ได้มีวัตถุประสงค์เพื่อก่อให้เกิดกิจกรรมทางการเงิน, การลงทุน, การซื้อขาย, ข้อเสนอแนะ หรือคำแนะนำประเภทอื่น ๆ ที่ให้หรือรับรองโดย TradingView อ่านเพิ่มเติมใน ข้อกำหนดการใช้งาน