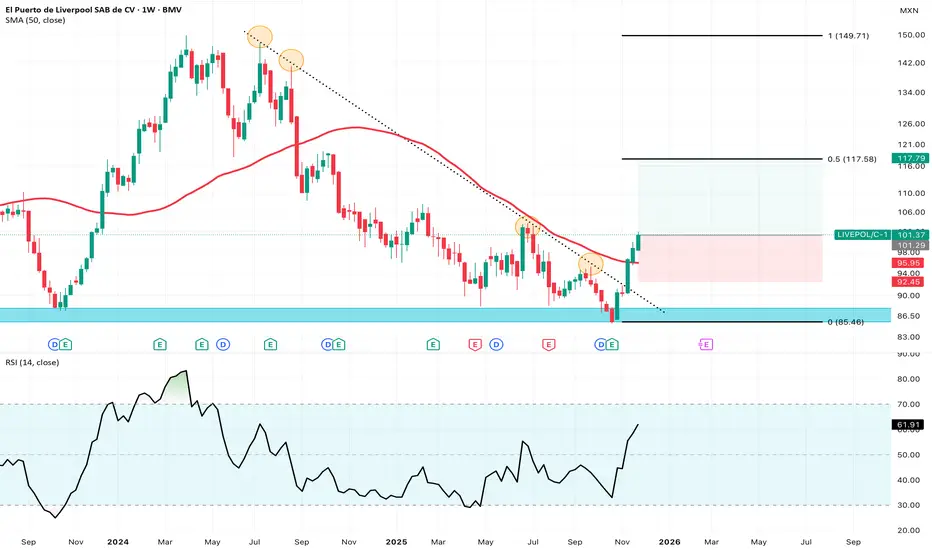
Stock price just broke a major downward trend line that has kept the price pressured since the last quarter of 2024. RSI breaching 50 after an aggressive bounce from the $85-$87 multi-year demand zone. The 50-week SMA, which was also surpassed, has recently been proved as an efficient trend indicator tool.
I’ve had a long position for some time now, so if I started a new one today, i would consider a 50% retracement from recent highs as a first price target, and a weekly close below the 50M SMA as a stop loss.
On the daily chart, the RSI is signaling extreme overbought conditions, so I wouldn’t be surprised if we saw some consolidation pattern form in the upcoming weeks.
I like this stock for the upcoming year.
คำจำกัดสิทธิ์ความรับผิดชอบ
ข้อมูลและบทความไม่ได้มีวัตถุประสงค์เพื่อก่อให้เกิดกิจกรรมทางการเงิน, การลงทุน, การซื้อขาย, ข้อเสนอแนะ หรือคำแนะนำประเภทอื่น ๆ ที่ให้หรือรับรองโดย TradingView อ่านเพิ่มเติมใน ข้อกำหนดการใช้งาน
คำจำกัดสิทธิ์ความรับผิดชอบ
ข้อมูลและบทความไม่ได้มีวัตถุประสงค์เพื่อก่อให้เกิดกิจกรรมทางการเงิน, การลงทุน, การซื้อขาย, ข้อเสนอแนะ หรือคำแนะนำประเภทอื่น ๆ ที่ให้หรือรับรองโดย TradingView อ่านเพิ่มเติมใน ข้อกำหนดการใช้งาน