เพิ่มขึ้น
Recurring VCP Structures: Multi-Phase Consolidation & Expansion
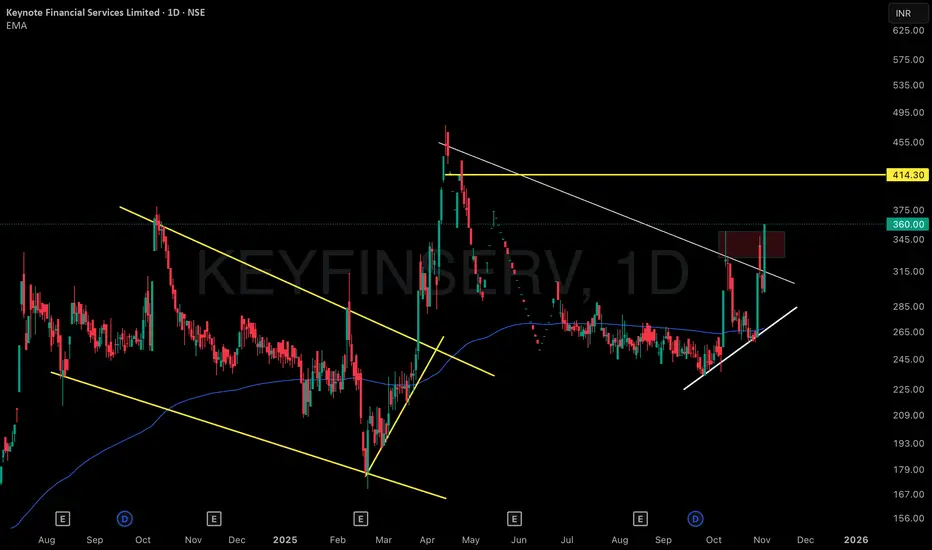
1 . This chart distinctly showcases a series of visually captivating Volatility Contraction Patterns (VCPs) across multiple phases, elegantly demarcated by yellow trendlines that map out both historical and present consolidation zones. Each contraction zone is marked by repeated, precise touches on trend boundaries, reflecting steady accumulation followed by eruptive volatility and sharp price expansions—almost like a pattern “echo” cycling through the chart.
2 . The highlighted VCP structures reveal not just one, but several contraction-and-expansion cycles, creating an intricate tapestry of market behaviour. Note how each phase includes a concentrated period of sideways price movement, where activity compresses before unleashing swift, directional breakouts. The interplay of these phases turns the chart into a textbook reference for sequential VCP observation, with periods of quiet consolidation—almost like calm before a storm—setting the stage for pronounced volatility bursts.
3 . Recent activity amplifies this effect: vivid volatility swings transition rapidly into tight consolidation, echoing earlier pattern cycles and further emphasizing the recurring structural nature. These technical formations, combined with strong boundary touches and clear momentum surges, make the chart an excellent study in pattern recognition, volatility monitoring, and visual market structure analysis—all shared purely for observational insight, with no predictions or directional bias.
🎯 Master My Self-Made Trading Strategy
📈 Telegram (Learn Today): t.me/hashtaghammer
✅ WhatsApp (Learn Today): wa.me/919455664601
📈 Telegram (Learn Today): t.me/hashtaghammer
✅ WhatsApp (Learn Today): wa.me/919455664601
การนำเสนอที่เกี่ยวข้อง
คำจำกัดสิทธิ์ความรับผิดชอบ
ข้อมูลและบทความไม่ได้มีวัตถุประสงค์เพื่อก่อให้เกิดกิจกรรมทางการเงิน, การลงทุน, การซื้อขาย, ข้อเสนอแนะ หรือคำแนะนำประเภทอื่น ๆ ที่ให้หรือรับรองโดย TradingView อ่านเพิ่มเติมใน ข้อกำหนดการใช้งาน