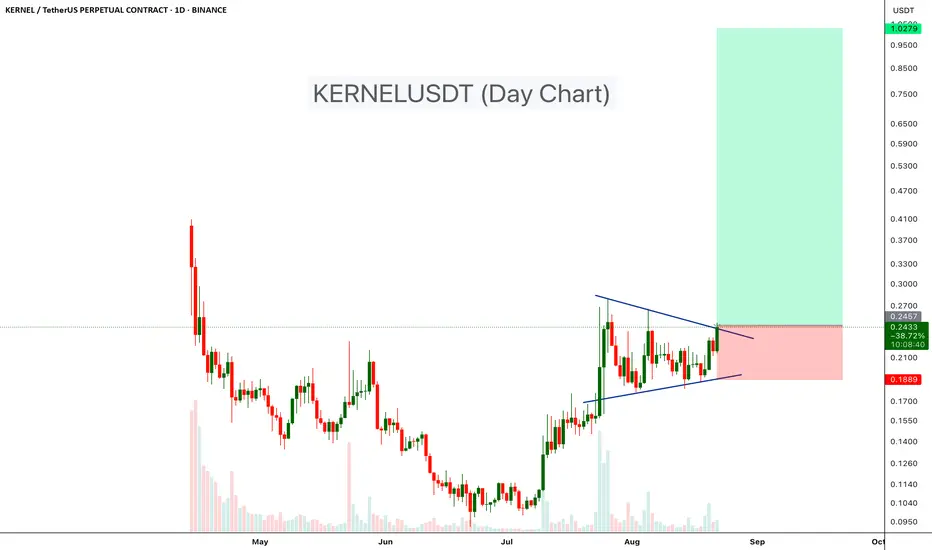
KERNELUSDT has been consolidating within a symmetrical triangle pattern on the daily chart, showing a battle between buyers and sellers after a strong uptrend. Recently, price has started breaking above the upper trendline, which could indicate the beginning of a fresh bullish move.
Pattern: Symmetrical Triangle
Entry Zone: Around current breakout levels (~0.24–0.25 USDT)
Target Zone: $0.5 - $1.00
Stop-Loss: Below 0.19 USDT (recent support)
Cheers
Hexa
Pattern: Symmetrical Triangle
Entry Zone: Around current breakout levels (~0.24–0.25 USDT)
Target Zone: $0.5 - $1.00
Stop-Loss: Below 0.19 USDT (recent support)
Cheers
Hexa
🚀Telegram : t.me/hexatrades
🌐Website: hexatrades.io/
🗣️Twitter(X): twitter.com/HexaTrades
🌐Website: hexatrades.io/
🗣️Twitter(X): twitter.com/HexaTrades
การนำเสนอที่เกี่ยวข้อง
คำจำกัดสิทธิ์ความรับผิดชอบ
ข้อมูลและบทความไม่ได้มีวัตถุประสงค์เพื่อก่อให้เกิดกิจกรรมทางการเงิน, การลงทุน, การซื้อขาย, ข้อเสนอแนะ หรือคำแนะนำประเภทอื่น ๆ ที่ให้หรือรับรองโดย TradingView อ่านเพิ่มเติมที่ ข้อกำหนดการใช้งาน