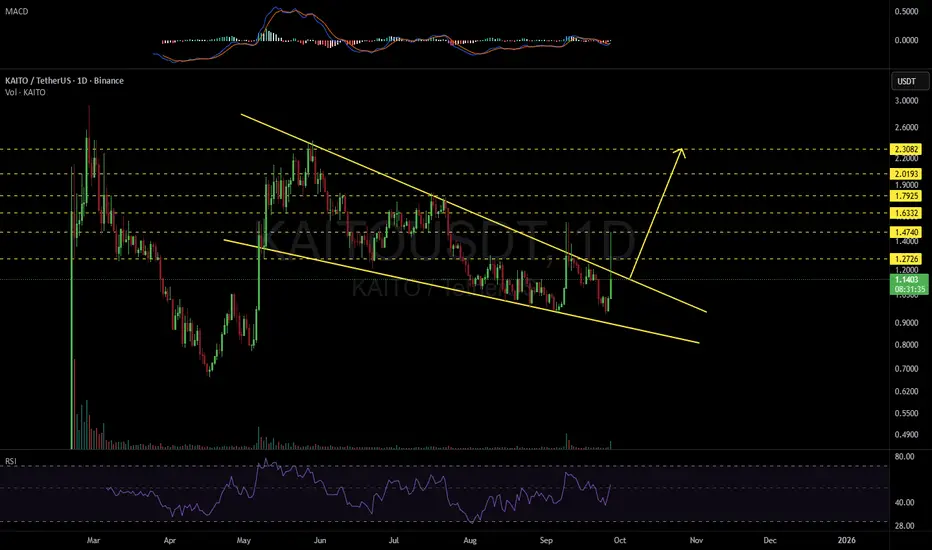
#KAITO is moving inside a falling wedge pattern on the daily chart. Volume has increased and RSI and MACD are turning bullish. #KAITO is on the verge of breaking out. If that happens, the potential targets are:
🎯 $1.2726
🎯 $1.4740
🎯 $1.6332
🎯 $1.7925
🎯 $2.0193
🎯 $2.3082
⚠️ Always remember to use a tight stop-loss and follow proper risk management.
🎯 $1.2726
🎯 $1.4740
🎯 $1.6332
🎯 $1.7925
🎯 $2.0193
🎯 $2.3082
⚠️ Always remember to use a tight stop-loss and follow proper risk management.
คำจำกัดสิทธิ์ความรับผิดชอบ
ข้อมูลและบทความไม่ได้มีวัตถุประสงค์เพื่อก่อให้เกิดกิจกรรมทางการเงิน, การลงทุน, การซื้อขาย, ข้อเสนอแนะ หรือคำแนะนำประเภทอื่น ๆ ที่ให้หรือรับรองโดย TradingView อ่านเพิ่มเติมที่ ข้อกำหนดการใช้งาน
คำจำกัดสิทธิ์ความรับผิดชอบ
ข้อมูลและบทความไม่ได้มีวัตถุประสงค์เพื่อก่อให้เกิดกิจกรรมทางการเงิน, การลงทุน, การซื้อขาย, ข้อเสนอแนะ หรือคำแนะนำประเภทอื่น ๆ ที่ให้หรือรับรองโดย TradingView อ่านเพิ่มเติมที่ ข้อกำหนดการใช้งาน