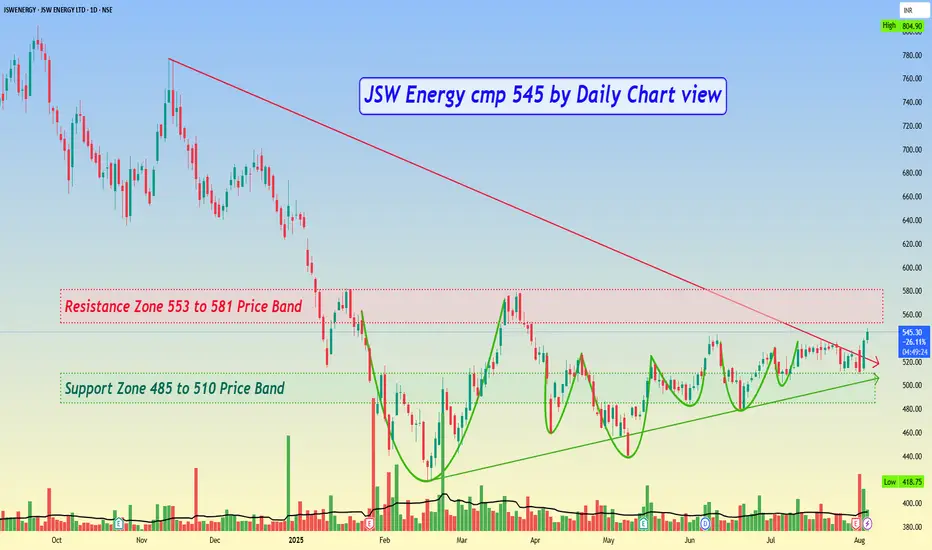
JSW Energy cmp 545 by Daily Chart view
- Support Zone 485 to 510 Price Band
- Resistance Zone 553 to 581 Price Band
- Falling Resistance Trendline Breakout has well sustained
- Rising Support Trendline well respected by upwards Price Momentum
- Multiple Bullish Rounding Bottoms plus considerate VCP pattern too, as viewed individually
- Support Zone 485 to 510 Price Band
- Resistance Zone 553 to 581 Price Band
- Falling Resistance Trendline Breakout has well sustained
- Rising Support Trendline well respected by upwards Price Momentum
- Multiple Bullish Rounding Bottoms plus considerate VCP pattern too, as viewed individually
คำจำกัดสิทธิ์ความรับผิดชอบ
ข้อมูลและบทความไม่ได้มีวัตถุประสงค์เพื่อก่อให้เกิดกิจกรรมทางการเงิน, การลงทุน, การซื้อขาย, ข้อเสนอแนะ หรือคำแนะนำประเภทอื่น ๆ ที่ให้หรือรับรองโดย TradingView อ่านเพิ่มเติมที่ ข้อกำหนดการใช้งาน
คำจำกัดสิทธิ์ความรับผิดชอบ
ข้อมูลและบทความไม่ได้มีวัตถุประสงค์เพื่อก่อให้เกิดกิจกรรมทางการเงิน, การลงทุน, การซื้อขาย, ข้อเสนอแนะ หรือคำแนะนำประเภทอื่น ๆ ที่ให้หรือรับรองโดย TradingView อ่านเพิ่มเติมที่ ข้อกำหนดการใช้งาน