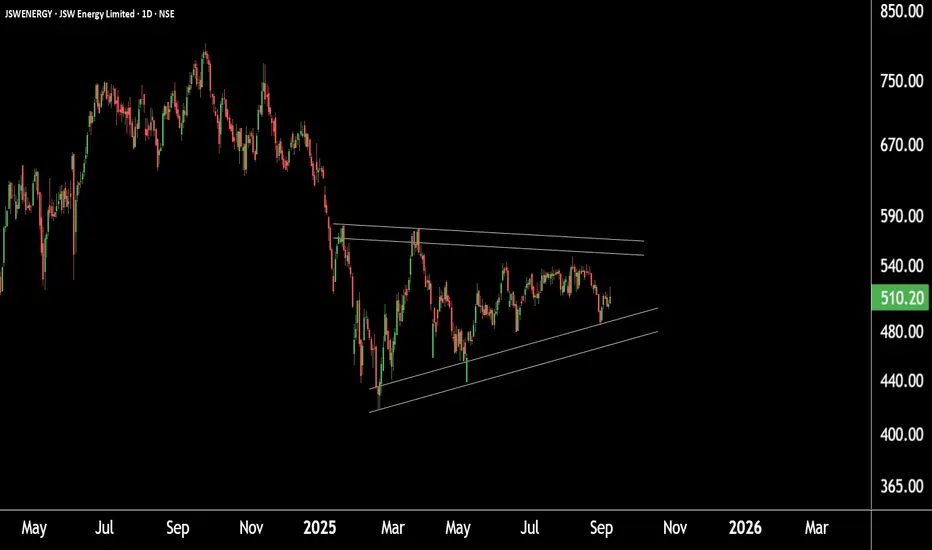
This is the daily timeframe chart of JSW Energy.
The stock is currently forming a symmetrical triangle pattern with support around ₹465–₹475 and resistance near ₹564–₹570.
If JSW Energy sustains above this resistance zone, it could trigger a breakout, potentially leading to higher price levels in the coming sessions.
Thank you.
The stock is currently forming a symmetrical triangle pattern with support around ₹465–₹475 and resistance near ₹564–₹570.
If JSW Energy sustains above this resistance zone, it could trigger a breakout, potentially leading to higher price levels in the coming sessions.
Thank you.
@RahulSaraoge
Connect us at t.me/stridesadvisory
Connect us at t.me/stridesadvisory
คำจำกัดสิทธิ์ความรับผิดชอบ
ข้อมูลและบทความไม่ได้มีวัตถุประสงค์เพื่อก่อให้เกิดกิจกรรมทางการเงิน, การลงทุน, การซื้อขาย, ข้อเสนอแนะ หรือคำแนะนำประเภทอื่น ๆ ที่ให้หรือรับรองโดย TradingView อ่านเพิ่มเติมที่ ข้อกำหนดการใช้งาน