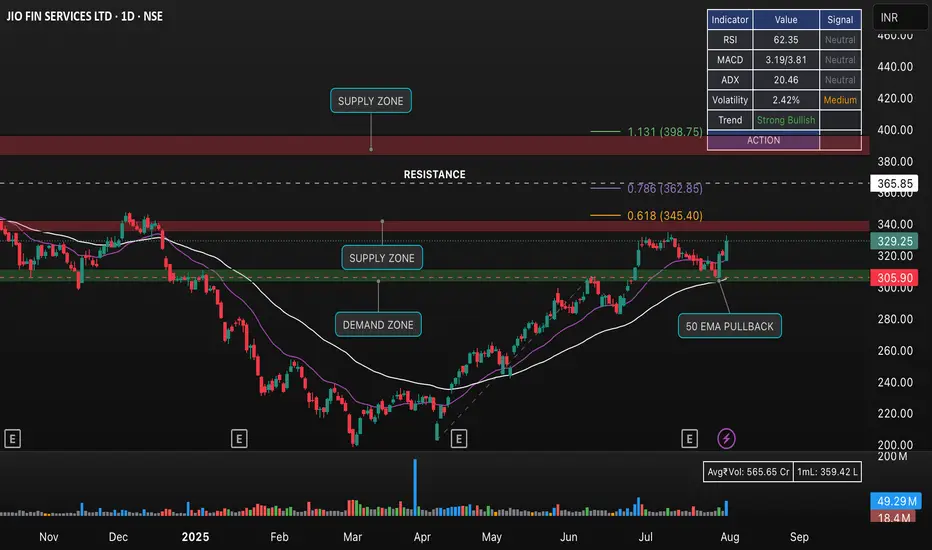
This daily chart of JIO FIN SERVICES LTD highlights the latest technical structure with a strong bullish trend. Key zones are marked:
• Supply Zones at 345–368 and 398–425 levels, where selling interest may emerge.
• Demand Zone at 285–310 levels, a potential support area.
• Fibonacci Levels: Price currently testing the 0.618 retracement at 345.40; next resistance at 0.786 (362.85).
• 50 EMA Pullback: Recent bounce from the 50 EMA, signaling buyer strength and a continuation potential.
• Key Resistance: 345–366 range is reinforced as a critical barrier.
• Indicators: RSI at 62, MACD and ADX neutral, volatility modest, trend marked “Strong Bullish.”
Watch for price action around supply/resistance zones and sustainability above 50 EMA for trend continuation or reversal signals. Suitable for short-term swing and positional traders watching breakout or pullback opportunities.
คำจำกัดสิทธิ์ความรับผิดชอบ
ข้อมูลและบทความไม่ได้มีวัตถุประสงค์เพื่อก่อให้เกิดกิจกรรมทางการเงิน, การลงทุน, การซื้อขาย, ข้อเสนอแนะ หรือคำแนะนำประเภทอื่น ๆ ที่ให้หรือรับรองโดย TradingView อ่านเพิ่มเติมที่ ข้อกำหนดการใช้งาน
คำจำกัดสิทธิ์ความรับผิดชอบ
ข้อมูลและบทความไม่ได้มีวัตถุประสงค์เพื่อก่อให้เกิดกิจกรรมทางการเงิน, การลงทุน, การซื้อขาย, ข้อเสนอแนะ หรือคำแนะนำประเภทอื่น ๆ ที่ให้หรือรับรองโดย TradingView อ่านเพิ่มเติมที่ ข้อกำหนดการใช้งาน