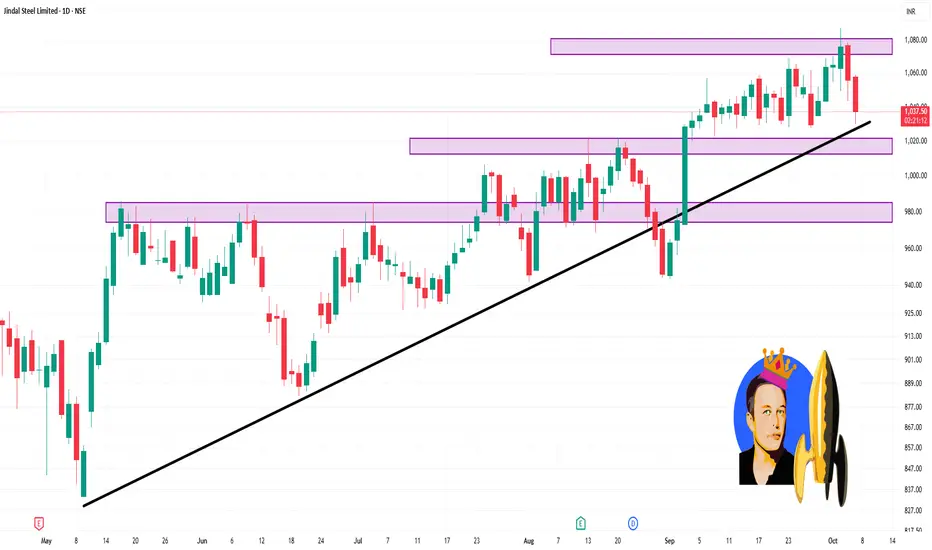
📈 Intraday Support & Resistance Levels
Resistance Levels:
₹1,078.87
₹1,071.93
₹1,063.47
Support Levels:
₹1,056.54
₹1,048.07
₹1,041.13
These levels are derived from pivot point calculations and are useful for short-term trading decisions.
🔍 Technical Indicators
Relative Strength Index (RSI): Currently at 39.78, indicating a bearish condition.
MACD: At -3.67, suggesting a bearish trend.
Moving Averages: The stock shows a strong sell outlook based on moving averages ranging from MA5 to MA200, with 2 buy signals and 10 sell signals.
การนำเสนอที่เกี่ยวข้อง
คำจำกัดสิทธิ์ความรับผิดชอบ
ข้อมูลและบทความไม่ได้มีวัตถุประสงค์เพื่อก่อให้เกิดกิจกรรมทางการเงิน, การลงทุน, การซื้อขาย, ข้อเสนอแนะ หรือคำแนะนำประเภทอื่น ๆ ที่ให้หรือรับรองโดย TradingView อ่านเพิ่มเติมที่ ข้อกำหนดการใช้งาน
การนำเสนอที่เกี่ยวข้อง
คำจำกัดสิทธิ์ความรับผิดชอบ
ข้อมูลและบทความไม่ได้มีวัตถุประสงค์เพื่อก่อให้เกิดกิจกรรมทางการเงิน, การลงทุน, การซื้อขาย, ข้อเสนอแนะ หรือคำแนะนำประเภทอื่น ๆ ที่ให้หรือรับรองโดย TradingView อ่านเพิ่มเติมที่ ข้อกำหนดการใช้งาน