📈 Key Intraday Levels
Opening Price: ₹722.05
Day’s High: ₹724.85
Day’s Low: ₹714.60
Closing Price: ₹719.20
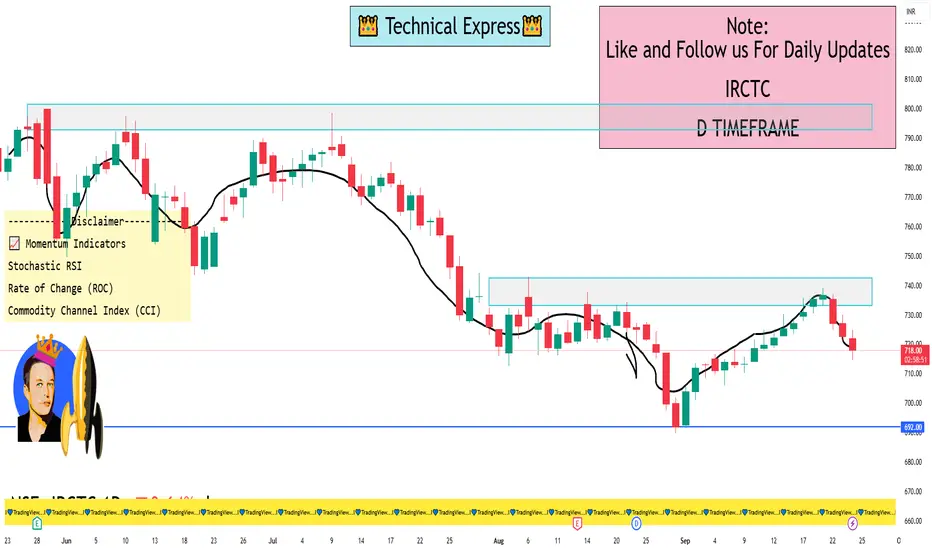
🔍 Technical Indicators
Support Level: ₹719.20 – This level is backed by accumulated volume, suggesting it may act as a reliable support point.
Resistance Level: ₹729.30 – The short-term moving average indicates this as a potential resistance point.
Volatility: The stock exhibited a 1.25% intraday range, with average daily volatility around 1.12%, indicating relatively stable movements.
📊 Momentum Indicators
Stochastic RSI: Currently in a neutral zone, suggesting neither overbought nor oversold conditions.
Rate of Change (ROC): Indicates a neutral condition, with no strong momentum in either direction.
Commodity Channel Index (CCI): Also in a neutral range, reflecting a lack of strong trend.
🛡️ Risk Management
Suggested Stop-Loss: ₹683.68 – Given the stock's low daily volatility, this stop-loss level offers a conservative risk management approach.
📌 Summary
IRCTC's stock is currently trading within a defined range, with support at ₹719.20 and resistance around ₹729.30. Momentum indicators suggest a neutral stance, indicating a wait-and-watch approach may be prudent for short-term traders. For those considering a longer-term perspective, the stock's low volatility and established support levels could present opportunities for accumulation, especially if it maintains above the ₹719.20 support.
Opening Price: ₹722.05
Day’s High: ₹724.85
Day’s Low: ₹714.60
Closing Price: ₹719.20
🔍 Technical Indicators
Support Level: ₹719.20 – This level is backed by accumulated volume, suggesting it may act as a reliable support point.
Resistance Level: ₹729.30 – The short-term moving average indicates this as a potential resistance point.
Volatility: The stock exhibited a 1.25% intraday range, with average daily volatility around 1.12%, indicating relatively stable movements.
📊 Momentum Indicators
Stochastic RSI: Currently in a neutral zone, suggesting neither overbought nor oversold conditions.
Rate of Change (ROC): Indicates a neutral condition, with no strong momentum in either direction.
Commodity Channel Index (CCI): Also in a neutral range, reflecting a lack of strong trend.
🛡️ Risk Management
Suggested Stop-Loss: ₹683.68 – Given the stock's low daily volatility, this stop-loss level offers a conservative risk management approach.
📌 Summary
IRCTC's stock is currently trading within a defined range, with support at ₹719.20 and resistance around ₹729.30. Momentum indicators suggest a neutral stance, indicating a wait-and-watch approach may be prudent for short-term traders. For those considering a longer-term perspective, the stock's low volatility and established support levels could present opportunities for accumulation, especially if it maintains above the ₹719.20 support.
I built a Buy & Sell Signal Indicator with 85% accuracy.
📈 Get access via DM or
WhatsApp: wa.link/d997q0
Contact - +91 76782 40962
| Email: techncialexpress@gmail.com
| Script Coder | Trader | Investor | From India
📈 Get access via DM or
WhatsApp: wa.link/d997q0
Contact - +91 76782 40962
| Email: techncialexpress@gmail.com
| Script Coder | Trader | Investor | From India
การนำเสนอที่เกี่ยวข้อง
คำจำกัดสิทธิ์ความรับผิดชอบ
ข้อมูลและบทความไม่ได้มีวัตถุประสงค์เพื่อก่อให้เกิดกิจกรรมทางการเงิน, การลงทุน, การซื้อขาย, ข้อเสนอแนะ หรือคำแนะนำประเภทอื่น ๆ ที่ให้หรือรับรองโดย TradingView อ่านเพิ่มเติมใน ข้อกำหนดการใช้งาน