📈 IPCA Laboratories – Weekly Technical Analysis (For Study Purpose Only)
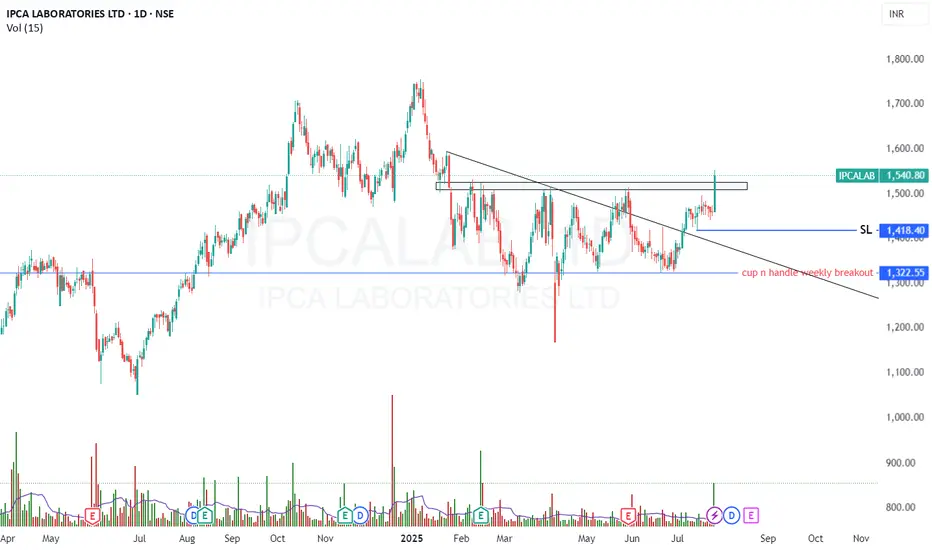
Ipca Labs has successfully completed a Cup and Handle breakout on the weekly chart, indicating a strong bullish setup after a prolonged consolidation phase.
After forming a double top and undergoing a nearly 6-month consolidation, the stock recently broke out above the neckline and range of ₹1320–₹1510, followed by a textbook retest of the breakout zone, which further strengthens the breakout's validity.
🔍 Key Technical Highlights:
✅ Pattern Formed: Weekly Cup and Handle retest and 6 month range breakout
📉 Previous Structure: Double top ➜ breakdown ➜ 6-month range consolidation
🔼 Breakout & Retest Zone: ₹1320–₹1510
✅ Retest Completed: Confirmed on weekly chart with supportive volume and price stability
🎯 Upside Targets:
Short-term: ₹1600
Medium-term: ₹1700
Long-term: New All-Time High (above ₹1750+)
🛑 Risk Management:
Stop-Loss: ₹1480 or (below retest zone)
📊 Supporting Indicators:
RSI trending upward, currently above 60 (bullish zone)
MACD crossover confirms positive momentum
Volume confirms strength during breakout
📌 Disclaimer: This analysis is for educational and study purposes only. Not a buy/sell recommendation.
คำจำกัดสิทธิ์ความรับผิดชอบ
ข้อมูลและบทความไม่ได้มีวัตถุประสงค์เพื่อก่อให้เกิดกิจกรรมทางการเงิน, การลงทุน, การซื้อขาย, ข้อเสนอแนะ หรือคำแนะนำประเภทอื่น ๆ ที่ให้หรือรับรองโดย TradingView อ่านเพิ่มเติมใน ข้อกำหนดการใช้งาน
คำจำกัดสิทธิ์ความรับผิดชอบ
ข้อมูลและบทความไม่ได้มีวัตถุประสงค์เพื่อก่อให้เกิดกิจกรรมทางการเงิน, การลงทุน, การซื้อขาย, ข้อเสนอแนะ หรือคำแนะนำประเภทอื่น ๆ ที่ให้หรือรับรองโดย TradingView อ่านเพิ่มเติมใน ข้อกำหนดการใช้งาน