เพิ่มขึ้น
IOVA Just Woke Up: Base Breakout, Volume Surge and $5+ in Sigth
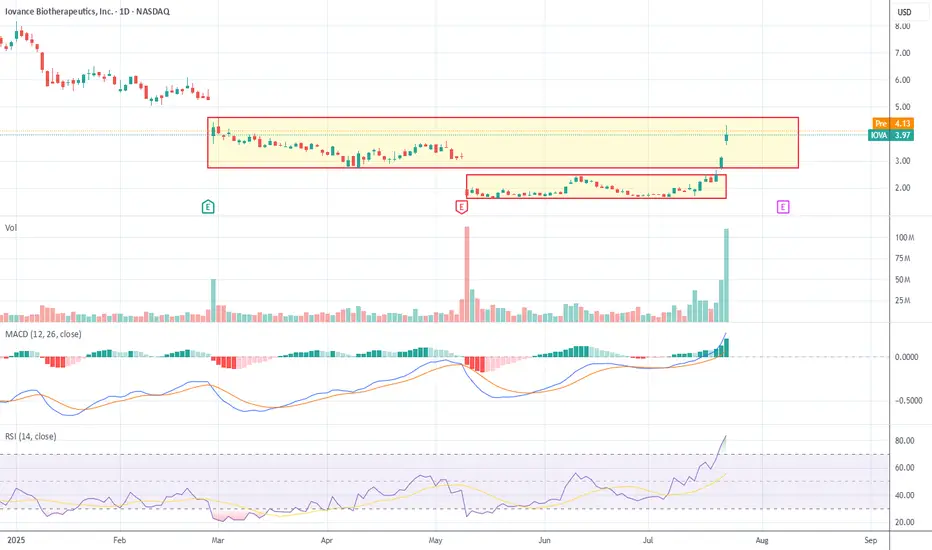
IOVA is breaking out in style. This is a rebound towards prior levels but the volume is impressive. Let's break it down
The latest candle is a marubozu (strong close near high), coming after a clean upside range expansion. Previous session was a high-volume thrust bar as well — together they create a bullish continuation pattern after a consolidation zone.
RSI confirms — now at 83.51, signaling extreme buying pressure. No topping pattern yet. This is trend continuation, not exhaustion — but it’s getting extended.
Trend: Just emerged from a multi-month base. MACD just had a clean crossover above zero. Histogram increasing — confirms ignition. Volume surging for multiple sessions — this is institutional accumulation or news-driven demand. RSI above 80 = emotional phase. Still bullish, but vulnerable to a short-term shakeout. Looks like funds that watched this base for months are now piling in fast.
Box Analysis
Old box was around $2.00–$2.50 → breakout started 3 sessions ago. Now price is forming a new box upper edge around $4.15–$4.30. Support zone: $3.20–$3.50 (prior gap, volume cluster). Resistance at $4.30.
If price consolidates under $4.30 for 1–3 sessions, this could turn into launchpad structure for next leg up.
Fibonacci Levels
Using recent swing low (~$1.60) to today’s high ($4.33):
Retracements:
23.6% = $3.70
38.2% = $3.25
50% = $2.96
61.8% = $2.68
Extensions:
127.2% = $5.08
161.8% = $5.72
Actionable Read
Long bias traders: Can trail stops under $3.70 or wait for consolidation near $4.15 to add.
Dip buyers: Watch $3.25–$3.50 zone for re-entry if price pulls back.
Shorts: No signal yet. Only viable if rejection forms at $4.30 or extended wick with volume divergence.
Next 3 likely playbook paths?
Continuation: Pushes to $5.08+ (127.2%) if volume remains strong.
Pullback & flag: Consolidates $3.50–$4.30 for 1–3 days, then resumes.
Fakeout: Breaks $3.20 and closes under $3.00 = bull trap.
คำจำกัดสิทธิ์ความรับผิดชอบ
ข้อมูลและบทความไม่ได้มีวัตถุประสงค์เพื่อก่อให้เกิดกิจกรรมทางการเงิน, การลงทุน, การซื้อขาย, ข้อเสนอแนะ หรือคำแนะนำประเภทอื่น ๆ ที่ให้หรือรับรองโดย TradingView อ่านเพิ่มเติมที่ ข้อกำหนดการใช้งาน
คำจำกัดสิทธิ์ความรับผิดชอบ
ข้อมูลและบทความไม่ได้มีวัตถุประสงค์เพื่อก่อให้เกิดกิจกรรมทางการเงิน, การลงทุน, การซื้อขาย, ข้อเสนอแนะ หรือคำแนะนำประเภทอื่น ๆ ที่ให้หรือรับรองโดย TradingView อ่านเพิ่มเติมที่ ข้อกำหนดการใช้งาน