📈Technical Analysis
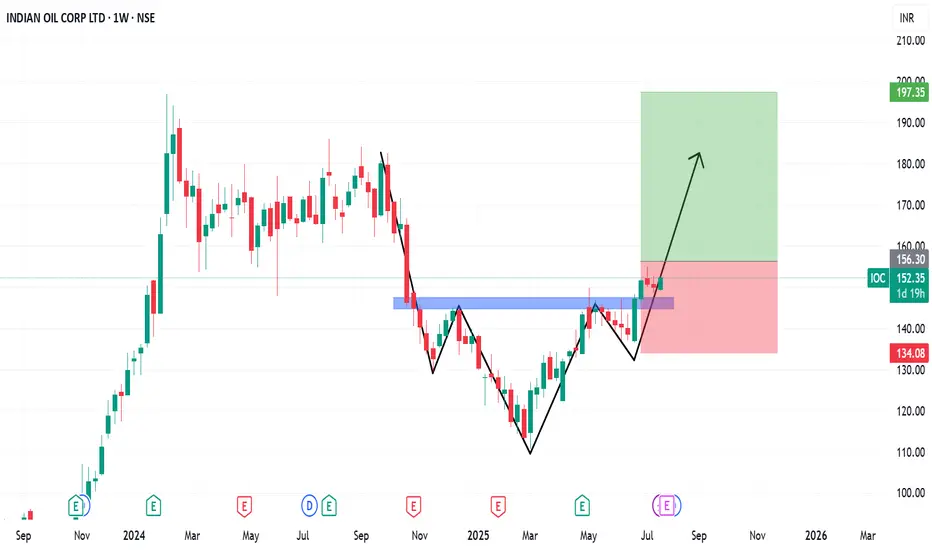
I am speaking about the IOC Ltd stock. Technically, I’ve been observing this stock’s chart for over two decades. In Feb 2024, it created an All-Time High at ₹197. From there, it consolidated till Sept 2024, followed by a sharp correction to ₹110 by March 2025. This ₹110 level acted as a strong demand zone and the stock rallied sharply from there.
Currently, it's trading at ₹152, forming an Inverse Head & Shoulder pattern, and the price has already broken above the neckline — a bullish signal.
🎯Targets
Target 1: ₹170
Target 2: ₹180
Target 3: ₹190
📉Stop Loss Levels
First Stop Loss: ₹135 (shoulder low)
Final Stop Loss: ₹110 (major demand zone)
💰Q4 FY24 Financial Highlights (vs Q3 FY24 & Q4 FY23)
🛢️IOC has benefited from softening crude oil prices and improved gross refining margins (GRMs), leading to better operating performance.
📦Strong inventory gains and better refining throughput also contributed to profitability.
💵The company declared a final dividend of ₹7 per share for FY24, rewarding shareholders amid solid earnings.
🏭Capex plans continue across petrochemical expansions and refinery upgrades, securing long-term growth.
🌱The management also highlighted a push toward energy transition — expanding green hydrogen and EV charging infrastructure.
Conclusion:
IOC Ltd is showing a strong technical breakout and backed by solid fundamentals in Q4. If the bullish pattern sustains, investors may see a retest of all-time highs in coming weeks.📊💹
I am speaking about the IOC Ltd stock. Technically, I’ve been observing this stock’s chart for over two decades. In Feb 2024, it created an All-Time High at ₹197. From there, it consolidated till Sept 2024, followed by a sharp correction to ₹110 by March 2025. This ₹110 level acted as a strong demand zone and the stock rallied sharply from there.
Currently, it's trading at ₹152, forming an Inverse Head & Shoulder pattern, and the price has already broken above the neckline — a bullish signal.
🎯Targets
Target 1: ₹170
Target 2: ₹180
Target 3: ₹190
📉Stop Loss Levels
First Stop Loss: ₹135 (shoulder low)
Final Stop Loss: ₹110 (major demand zone)
💰Q4 FY24 Financial Highlights (vs Q3 FY24 & Q4 FY23)
- Total Income: ₹1,95,270 Cr (↑ flat vs ₹1,94,014 Cr; ↓ -2% vs ₹1,98,650 Cr)
- Total Expenses: ₹1,80,241 Cr (↓ -3% vs ₹1,86,442 Cr; ↓ -4% vs ₹1,86,675 Cr)
- Operating Profit: ₹15,029 Cr (↑ +98% vs ₹7,573 Cr; ↑ +25% vs ₹11,975 Cr)
- Profit Before Tax: ₹10,045 Cr (↑ +263% vs ₹2,766 Cr; ↑ +35% vs ₹7,420 Cr)
- Profit After Tax: ₹8,368 Cr (↑ +290% vs ₹2,147 Cr; ↑ +52% vs ₹5,488 Cr)
- Diluted EPS: ₹5.75 (↑ from ₹1.50 QoQ; ↑ from ₹3.65 YoY)
🛢️IOC has benefited from softening crude oil prices and improved gross refining margins (GRMs), leading to better operating performance.
📦Strong inventory gains and better refining throughput also contributed to profitability.
💵The company declared a final dividend of ₹7 per share for FY24, rewarding shareholders amid solid earnings.
🏭Capex plans continue across petrochemical expansions and refinery upgrades, securing long-term growth.
🌱The management also highlighted a push toward energy transition — expanding green hydrogen and EV charging infrastructure.
Conclusion:
IOC Ltd is showing a strong technical breakout and backed by solid fundamentals in Q4. If the bullish pattern sustains, investors may see a retest of all-time highs in coming weeks.📊💹
คำจำกัดสิทธิ์ความรับผิดชอบ
ข้อมูลและบทความไม่ได้มีวัตถุประสงค์เพื่อก่อให้เกิดกิจกรรมทางการเงิน, การลงทุน, การซื้อขาย, ข้อเสนอแนะ หรือคำแนะนำประเภทอื่น ๆ ที่ให้หรือรับรองโดย TradingView อ่านเพิ่มเติมที่ ข้อกำหนดการใช้งาน
คำจำกัดสิทธิ์ความรับผิดชอบ
ข้อมูลและบทความไม่ได้มีวัตถุประสงค์เพื่อก่อให้เกิดกิจกรรมทางการเงิน, การลงทุน, การซื้อขาย, ข้อเสนอแนะ หรือคำแนะนำประเภทอื่น ๆ ที่ให้หรือรับรองโดย TradingView อ่านเพิ่มเติมที่ ข้อกำหนดการใช้งาน