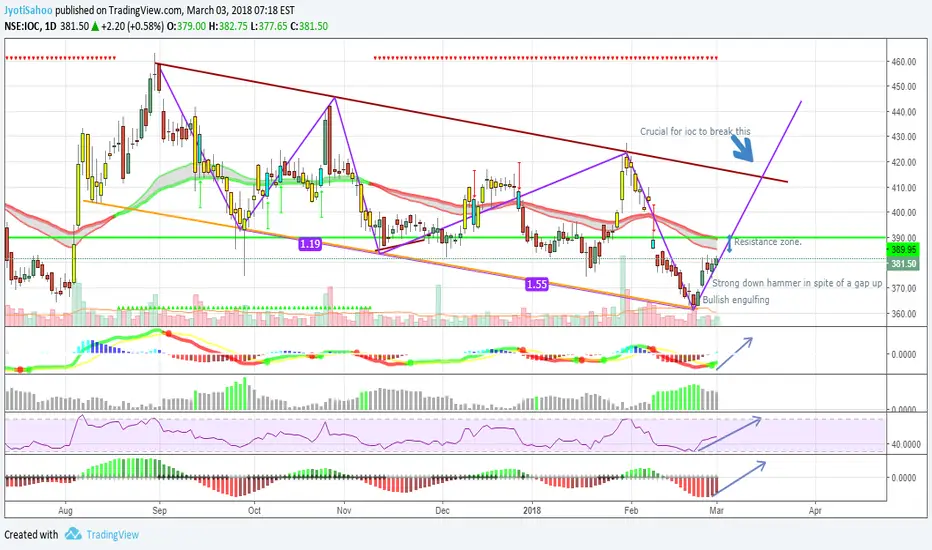
IOC on a daily chart is following a down channel .lower lows are being formed. and lower highs. this is a false recovery probably upto 414 . oscillators and tech indicators are in favor . this can be cashed in. the last 5 candles are pretty strong. but if we see a channel break out that will be a big bonus.
There is resistance zone around 390. if the stock sees to hold that level and volumes pick up . we can see upmove.
There is resistance zone around 390. if the stock sees to hold that level and volumes pick up . we can see upmove.
การซื้อขายยังคงดำเนินอยู่
บันทึก
20 points profit. closing just above 400 was a very good sign.คำจำกัดสิทธิ์ความรับผิดชอบ
ข้อมูลและบทความไม่ได้มีวัตถุประสงค์เพื่อก่อให้เกิดกิจกรรมทางการเงิน, การลงทุน, การซื้อขาย, ข้อเสนอแนะ หรือคำแนะนำประเภทอื่น ๆ ที่ให้หรือรับรองโดย TradingView อ่านเพิ่มเติมใน ข้อกำหนดการใช้งาน
คำจำกัดสิทธิ์ความรับผิดชอบ
ข้อมูลและบทความไม่ได้มีวัตถุประสงค์เพื่อก่อให้เกิดกิจกรรมทางการเงิน, การลงทุน, การซื้อขาย, ข้อเสนอแนะ หรือคำแนะนำประเภทอื่น ๆ ที่ให้หรือรับรองโดย TradingView อ่านเพิ่มเติมใน ข้อกำหนดการใช้งาน