Current Trend & Technical Overview
On daily analysis, the stock is in a Strong Buy zone, with all moving averages across 5-, 10-, 20-, 50-, 100-, and 200-day periods signaling buy, alongside predominantly bullish indicators such as RSI (~74.9), MACD, ADX, ROC, and more
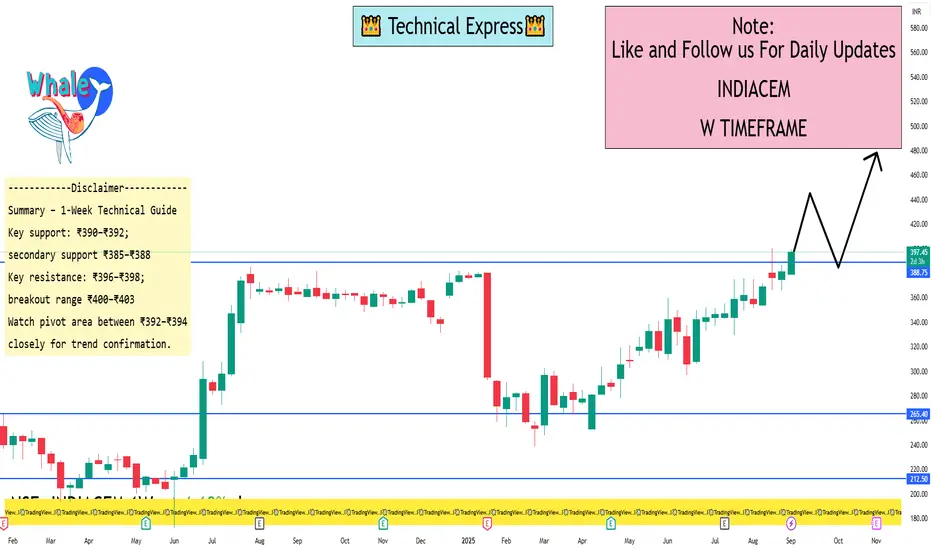
The stock is trading near its 52-week high (~₹400), with a current range of approximately ₹385–₹398
Analysts maintain a Strong Buy technical stance, though consensus price targets indicate potential downside (~₹282 avg target vs current ~₹397), suggesting valuation may be extended
1-Week Technical Levels
Pivot Points (from Investing.com data):
Classic Pivots (Daily):
S1: ₹390.16
Pivot: ₹392.48
R1: ₹396.61
R2: ₹398.93
R3: ₹403.06
Supports: down to ₹383.71
Fibonacci, Camarilla, and Woodie pivots are closely clustered—suggest key levels between ₹392–₹394 (pivot), with resistance around ₹396–₹398 and support near ₹386–₹390
TradingView Idea (dated August):
Bullish Entry: Daily close above ₹232/₹239, safe entry above ₹269.
Targets: ₹291–₹296 initially; further upside to ₹350–₹354 and ₹409–₹413.
Bearish Risk: Close below ₹223 may expose ₹203 and ₹173
(Note: Those levels are older and far below current prices; still helpful historically.)
On daily analysis, the stock is in a Strong Buy zone, with all moving averages across 5-, 10-, 20-, 50-, 100-, and 200-day periods signaling buy, alongside predominantly bullish indicators such as RSI (~74.9), MACD, ADX, ROC, and more
The stock is trading near its 52-week high (~₹400), with a current range of approximately ₹385–₹398
Analysts maintain a Strong Buy technical stance, though consensus price targets indicate potential downside (~₹282 avg target vs current ~₹397), suggesting valuation may be extended
1-Week Technical Levels
Pivot Points (from Investing.com data):
Classic Pivots (Daily):
S1: ₹390.16
Pivot: ₹392.48
R1: ₹396.61
R2: ₹398.93
R3: ₹403.06
Supports: down to ₹383.71
Fibonacci, Camarilla, and Woodie pivots are closely clustered—suggest key levels between ₹392–₹394 (pivot), with resistance around ₹396–₹398 and support near ₹386–₹390
TradingView Idea (dated August):
Bullish Entry: Daily close above ₹232/₹239, safe entry above ₹269.
Targets: ₹291–₹296 initially; further upside to ₹350–₹354 and ₹409–₹413.
Bearish Risk: Close below ₹223 may expose ₹203 and ₹173
(Note: Those levels are older and far below current prices; still helpful historically.)
I built a Buy & Sell Signal Indicator with 85% accuracy.
📈 Get access via DM or
WhatsApp: wa.link/d997q0
| Email: techncialexpress@gmail.com
| Script Coder | Trader | Investor | From India
📈 Get access via DM or
WhatsApp: wa.link/d997q0
| Email: techncialexpress@gmail.com
| Script Coder | Trader | Investor | From India
การนำเสนอที่เกี่ยวข้อง
คำจำกัดสิทธิ์ความรับผิดชอบ
ข้อมูลและบทความไม่ได้มีวัตถุประสงค์เพื่อก่อให้เกิดกิจกรรมทางการเงิน, การลงทุน, การซื้อขาย, ข้อเสนอแนะ หรือคำแนะนำประเภทอื่น ๆ ที่ให้หรือรับรองโดย TradingView อ่านเพิ่มเติมที่ ข้อกำหนดการใช้งาน