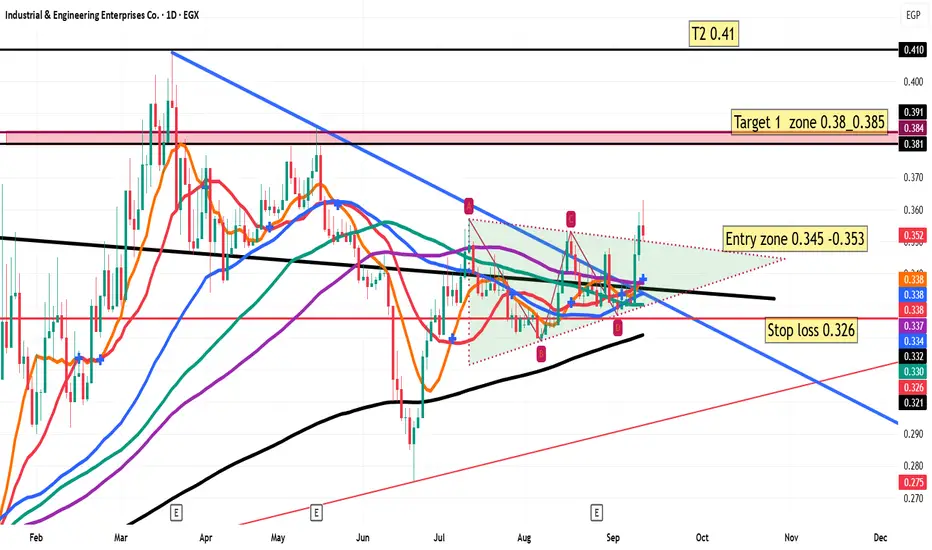
Industrial & Engineering Enterprises Co. (IEEC) – EGX, Daily Chart
Entry Zone: 0.345 – 0.353
Stop Loss: 0.326
Target 1: 0.380 – 0.385
Target 2: 0.410
Bullish Scenario:
The stock has successfully broken out of a symmetrical consolidation pattern, supported by rising moving averages and stronger bullish candles. As long as the price sustains above 0.345, the momentum favors a move towards the first resistance zone at 0.380 – 0.385. A confirmed breakout above this zone could accelerate the rally towards 0.410.
Bearish Scenario:
Failure to hold above the entry zone, particularly a daily close below 0.326, would invalidate the bullish outlook and expose the stock to further downside pressure.
Conclusion:
The setup offers a favorable risk-to-reward ratio, with the stock currently trading inside the defined entry zone. Monitoring the price action near 0.385 is crucial, as this level represents a decisive resistance for the next leg higher.
คำจำกัดสิทธิ์ความรับผิดชอบ
ข้อมูลและบทความไม่ได้มีวัตถุประสงค์เพื่อก่อให้เกิดกิจกรรมทางการเงิน, การลงทุน, การซื้อขาย, ข้อเสนอแนะ หรือคำแนะนำประเภทอื่น ๆ ที่ให้หรือรับรองโดย TradingView อ่านเพิ่มเติมที่ ข้อกำหนดการใช้งาน
คำจำกัดสิทธิ์ความรับผิดชอบ
ข้อมูลและบทความไม่ได้มีวัตถุประสงค์เพื่อก่อให้เกิดกิจกรรมทางการเงิน, การลงทุน, การซื้อขาย, ข้อเสนอแนะ หรือคำแนะนำประเภทอื่น ๆ ที่ให้หรือรับรองโดย TradingView อ่านเพิ่มเติมที่ ข้อกำหนดการใช้งาน