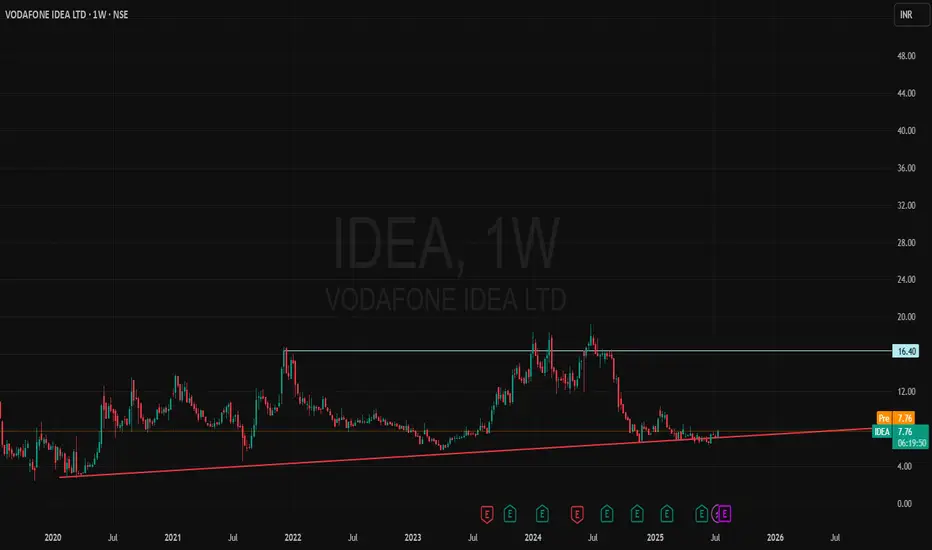
📌 Vodafone Idea Ltd – Chart at Crucial Support Zone
🔍 Stock has successfully respected long-term support near ₹6.10–7.40 multiple times since 2021.
✅ Recent bounce backed by strong volume and improving technical structure.
✅ Gradual accumulation visible since past few weeks.
✅ RSI and price action both attempting to hold higher lows.
✅ OBV and momentum indicators hinting at early signs of recovery.
✅ Price trading inside a broad ascending triangle pattern since 2020 – potential breakout above ₹9 could confirm long-term trend reversal.
🧠 Risk-Reward looks favourable for long-term positional investors from current levels, with strict SL near ₹6.10.
🎯 Ideal for positional traders & long-term investors with a medium-term view.
📝 Note: Please do your own due diligence. This is not a recommendation, just a view based on charts and fundamentals.
🧠 Disclaimer: For educational and research purposes only. No buy/sell advice.
📝 Chart Purpose & Disclaimer:
This chart is shared purely for educational and personal tracking purposes. I use this space to record my views and improve decision-making over time.
Investment Style:
All stocks posted are for long-term investment or minimum positional trades only. No intraday or speculative trades are intended.
⚠️ Disclaimer:
I am not a SEBI registered advisor. These are not buy/sell recommendations. Please consult a qualified financial advisor before taking any investment decision. I do not take responsibility for any profit or loss incurred based on this content.
คำจำกัดสิทธิ์ความรับผิดชอบ
ข้อมูลและบทความไม่ได้มีวัตถุประสงค์เพื่อก่อให้เกิดกิจกรรมทางการเงิน, การลงทุน, การซื้อขาย, ข้อเสนอแนะ หรือคำแนะนำประเภทอื่น ๆ ที่ให้หรือรับรองโดย TradingView อ่านเพิ่มเติมที่ ข้อกำหนดการใช้งาน
คำจำกัดสิทธิ์ความรับผิดชอบ
ข้อมูลและบทความไม่ได้มีวัตถุประสงค์เพื่อก่อให้เกิดกิจกรรมทางการเงิน, การลงทุน, การซื้อขาย, ข้อเสนอแนะ หรือคำแนะนำประเภทอื่น ๆ ที่ให้หรือรับรองโดย TradingView อ่านเพิ่มเติมที่ ข้อกำหนดการใช้งาน