💹 ICICI Bank Ltd (NSE: ICICIBANK)
Sector: Banking & Financial Services | CMP: 1392.20 | View: Fibonacci Reversal + Trendline Breakout Attempt
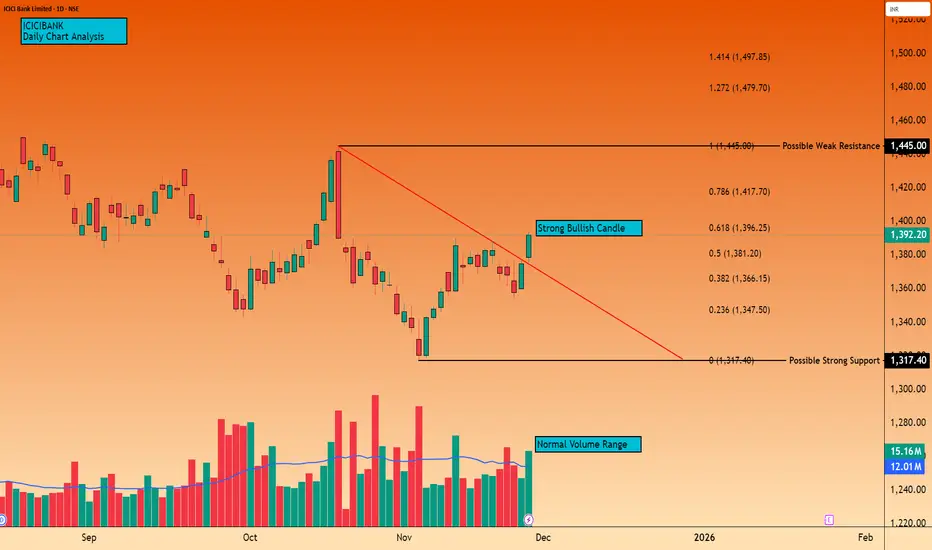
Chart Pattern: Descending Trendline Breakout
Candlestick Pattern: Strong Bullish Momentum Candle
Swing High: 1445
Swing Low: 1317.40
STWP Trade Analysis:
Bullish Breakout Level: 1394
Stop Loss: 1353
Momentum: Strong
Volume: High participation buildup
The price has bounced sharply from the 0.382–0.5 Fibonacci retracement pocket, breaking above the descending trendline with a strong bullish candle. Volume expansion confirms active buying interest, signalling institutional accumulation from lower levels. The shift from contraction (falling structure) to expansion (breakout candle) indicates buyers reclaiming dominance and defending higher lows consistently.
Resistances:
1398.9 | 1405.6 | 1417.2
Supports:
1380.6 | 1369 | 1362.3
STWP Stock Analysis:
Final Outlook:
Momentum: Strong | Trend: Bullish Bias Developing | Risk: Moderate | Volume: High
ICICI Bank has rebounded strongly from the Fibonacci retracement structure, reclaiming key levels and breaking above the trendline that previously controlled price action. This confirms the transition from corrective movement into a fresh upward attempt. Volume strength shows that this move is not a random spike but a coordinated push from stronger hands.
RSI has turned upward from the balanced zone, CCI is strengthening above the positive threshold, and MACD is close to a momentum confirmation crossover — all indicating internal strength building behind the price. EMA compression across the last several sessions is easing, suggesting the early stage of a directional move.
The series of controlled declines over the past month resemble VCP-like contractions, followed by today’s momentum expansion candle. Sustaining above the 1381–1366 zone keeps the bullish structure intact and opens the path toward the resistance band at 1398 → 1405 → 1417, with 1445 acting as the extended resistance if momentum continues.
Overall, ICICI Bank stands at the onset of a potential continuation leg, backed by strong volume, clean Fibonacci structure, and a clear breakout from its corrective trendline. Holding the demand zones below will strengthen follow-through possibilities and create additional opportunities for traders on dips.
Traders should watch how the stock behaves on minor dips or pullbacks toward the 1381–1366 demand band. Healthy retests within this zone often provide strong secondary entries in momentum setups.
This document is strictly for educational and informational purposes. This analysis is purely observational and does not qualify as investment research under SEBI regulations. All examples, charts, levels, and structures discussed are illustrative and are not intended as buy, sell, or hold recommendations. STWP does not provide investment advice, trading tips, signals, or personalized financial guidance of any kind, nor is it a SEBI-registered intermediary or research analyst. The analyses and risk–reward structures included here are generic in nature and based on publicly available information, which may change without notice. Financial markets involve significant risk; derivatives in particular carry the potential for substantial losses. Readers are solely responsible for their trading decisions, capital management, and risk assessment.
Always consult a SEBI-registered investment advisor before making any financial decisions. STWP and its team shall not be liable for any direct or indirect losses arising from the use of this material. Historical patterns never guarantee future outcomes.
Position Status: No active position in ICICIBANK at the time of analysis.
Data Source: TradingView & NSE India.
💬 Found this useful?
🔼 Boost this post to support structured learning
✍️ Share your thoughts or questions in the comments
🔁 Forward this to traders who value clean technical studies
👉 Follow for disciplined, structured, STWP-style analysis
🚀 Stay Calm. Stay Clean. Trade With Patience.
Trade Smart | Learn Zones | Be Self-Reliant 📊
Sector: Banking & Financial Services | CMP: 1392.20 | View: Fibonacci Reversal + Trendline Breakout Attempt
Chart Pattern: Descending Trendline Breakout
Candlestick Pattern: Strong Bullish Momentum Candle
Swing High: 1445
Swing Low: 1317.40
STWP Trade Analysis:
Bullish Breakout Level: 1394
Stop Loss: 1353
Momentum: Strong
Volume: High participation buildup
The price has bounced sharply from the 0.382–0.5 Fibonacci retracement pocket, breaking above the descending trendline with a strong bullish candle. Volume expansion confirms active buying interest, signalling institutional accumulation from lower levels. The shift from contraction (falling structure) to expansion (breakout candle) indicates buyers reclaiming dominance and defending higher lows consistently.
Resistances:
1398.9 | 1405.6 | 1417.2
Supports:
1380.6 | 1369 | 1362.3
STWP Stock Analysis:
Final Outlook:
Momentum: Strong | Trend: Bullish Bias Developing | Risk: Moderate | Volume: High
ICICI Bank has rebounded strongly from the Fibonacci retracement structure, reclaiming key levels and breaking above the trendline that previously controlled price action. This confirms the transition from corrective movement into a fresh upward attempt. Volume strength shows that this move is not a random spike but a coordinated push from stronger hands.
RSI has turned upward from the balanced zone, CCI is strengthening above the positive threshold, and MACD is close to a momentum confirmation crossover — all indicating internal strength building behind the price. EMA compression across the last several sessions is easing, suggesting the early stage of a directional move.
The series of controlled declines over the past month resemble VCP-like contractions, followed by today’s momentum expansion candle. Sustaining above the 1381–1366 zone keeps the bullish structure intact and opens the path toward the resistance band at 1398 → 1405 → 1417, with 1445 acting as the extended resistance if momentum continues.
Overall, ICICI Bank stands at the onset of a potential continuation leg, backed by strong volume, clean Fibonacci structure, and a clear breakout from its corrective trendline. Holding the demand zones below will strengthen follow-through possibilities and create additional opportunities for traders on dips.
Traders should watch how the stock behaves on minor dips or pullbacks toward the 1381–1366 demand band. Healthy retests within this zone often provide strong secondary entries in momentum setups.
This document is strictly for educational and informational purposes. This analysis is purely observational and does not qualify as investment research under SEBI regulations. All examples, charts, levels, and structures discussed are illustrative and are not intended as buy, sell, or hold recommendations. STWP does not provide investment advice, trading tips, signals, or personalized financial guidance of any kind, nor is it a SEBI-registered intermediary or research analyst. The analyses and risk–reward structures included here are generic in nature and based on publicly available information, which may change without notice. Financial markets involve significant risk; derivatives in particular carry the potential for substantial losses. Readers are solely responsible for their trading decisions, capital management, and risk assessment.
Always consult a SEBI-registered investment advisor before making any financial decisions. STWP and its team shall not be liable for any direct or indirect losses arising from the use of this material. Historical patterns never guarantee future outcomes.
Position Status: No active position in ICICIBANK at the time of analysis.
Data Source: TradingView & NSE India.
💬 Found this useful?
🔼 Boost this post to support structured learning
✍️ Share your thoughts or questions in the comments
🔁 Forward this to traders who value clean technical studies
👉 Follow for disciplined, structured, STWP-style analysis
🚀 Stay Calm. Stay Clean. Trade With Patience.
Trade Smart | Learn Zones | Be Self-Reliant 📊
STWP | Mentor & Demand-Supply Specialist | Empowering traders through structured learning |
simpletradewithpatience.com
Community: chat.whatsapp.com/BEYz0tkqP0fJPBCWf59uel
wa.me/message/6IOPHGOXMGZ4N1
Educational Only
simpletradewithpatience.com
Community: chat.whatsapp.com/BEYz0tkqP0fJPBCWf59uel
wa.me/message/6IOPHGOXMGZ4N1
Educational Only
คำจำกัดสิทธิ์ความรับผิดชอบ
ข้อมูลและบทความไม่ได้มีวัตถุประสงค์เพื่อก่อให้เกิดกิจกรรมทางการเงิน, การลงทุน, การซื้อขาย, ข้อเสนอแนะ หรือคำแนะนำประเภทอื่น ๆ ที่ให้หรือรับรองโดย TradingView อ่านเพิ่มเติมใน ข้อกำหนดการใช้งาน